To study the behavior of any material which is subjected to a load, it is possible by relating the stress with strain while gradually increasing the load. the graph between the stress and strain is known as Stress strain Curve.
Stress strain curve
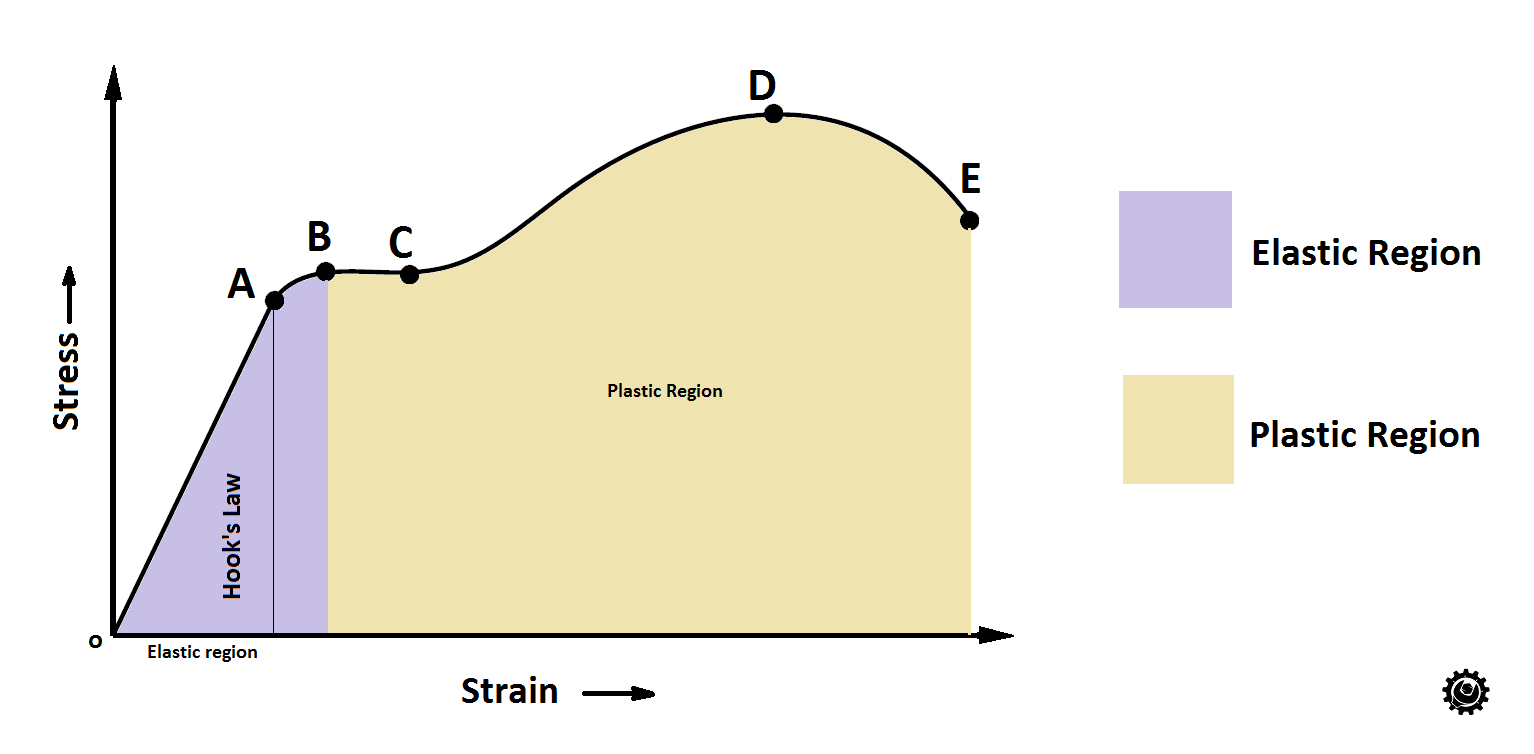
If we draw a graph between stress and strain while applying a load on a body, the above Stress strain curve represents the behavior of the body with respect to the applied load. (Take Stress on Y-axis and Strain on X-axis.)
There are two behaviors of the metals, in this case as represented in the above diagram, they are
- Elastic behavior: the body will get its original shape when the load is removed.
- Plastic behavior: Permanent deformation happen (No restoring forces).
As the curve is divided into five regions as noted on the curve as shown in the above diagram. They are
O-A: Proportional limit
In the above Stress strain diagram, the curve o-A represents the Proportional limit.
It obeys Hook’s law. The stress is directly proportional to strain.
The material will get its original shape when the load is removed.
A-B: Elastic Region
In this region this will not obey Hook’s law, However, the material is still elastic in this region.
which means the material can get its original shape when the applied load is removed. but not in a proportional manner.
Point B Is called Elastic limit.
B-C: Yield Stress
Where in stress strain diagram The path B-C represents the yield stress. where the body takes the deformation permanently with no/Little increase in the stress. This stress is called yield stress point.
C-D: Ultimate Stress
From the Yield stress point (C) to the Ultimate stress point, a small increase in stress Causes more deformation.
This is the maximum stress that material has to bear before it going to be brake or fail.
E: Rupture Point/Breaking
If the applied load crosses the Ultimate stress(maximum bearing capacity of the material), with no increase in the stress, the body will fail at this point. This is called breaking point or Rupture point.
See the curve between the D and E, The stress drops after the point D and at point E this body starts breaking.
Tensile Test and Engineering Stress Strain Curve
The tensile test is used to evaluate the strength and stiffness of metals and alloys among other properties. In this test, a metal sample is pulled to failure in a relatively short time at a constant rate.
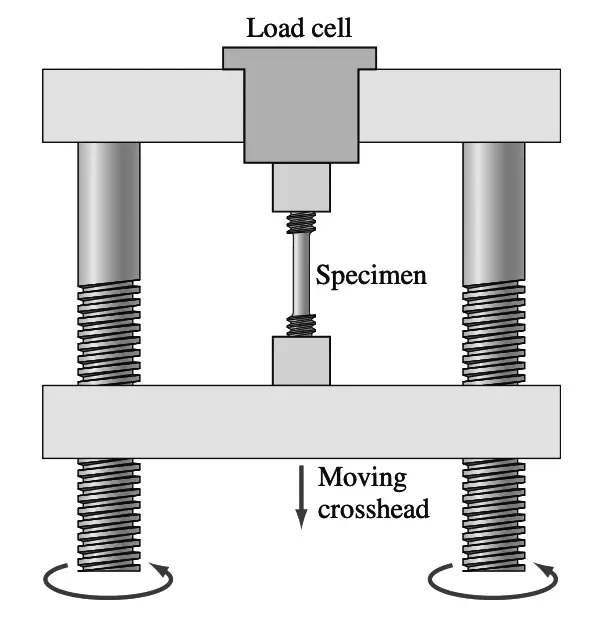
The above figure illustrates schematically how the sample is tested in tension. The force (load) on the specimen being tested is measured by the load cell, while the strain is obtained from the extensometer attached to the specimen, and the data is collected in a computer-controlled software package.
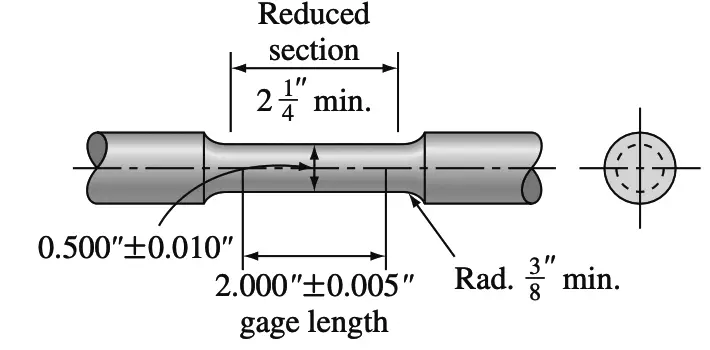
The types of samples used for the tensile test vary considerably. For metals with a thick cross-section such as plate, a 0.50-in.-diameter round specimen is commonly used as shown in the below figure.
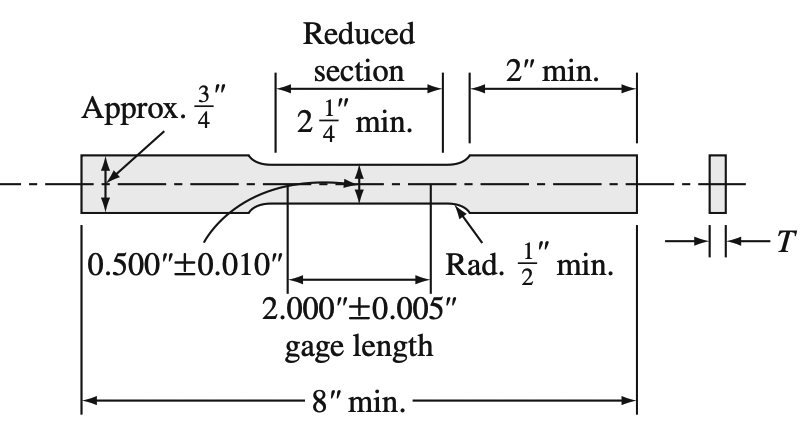
For metal with thinner cross-sections such as sheets, a flat specimen is used in the below figure. A 2-in. gage length within the specimen is the most commonly used gage length for tensile tests.
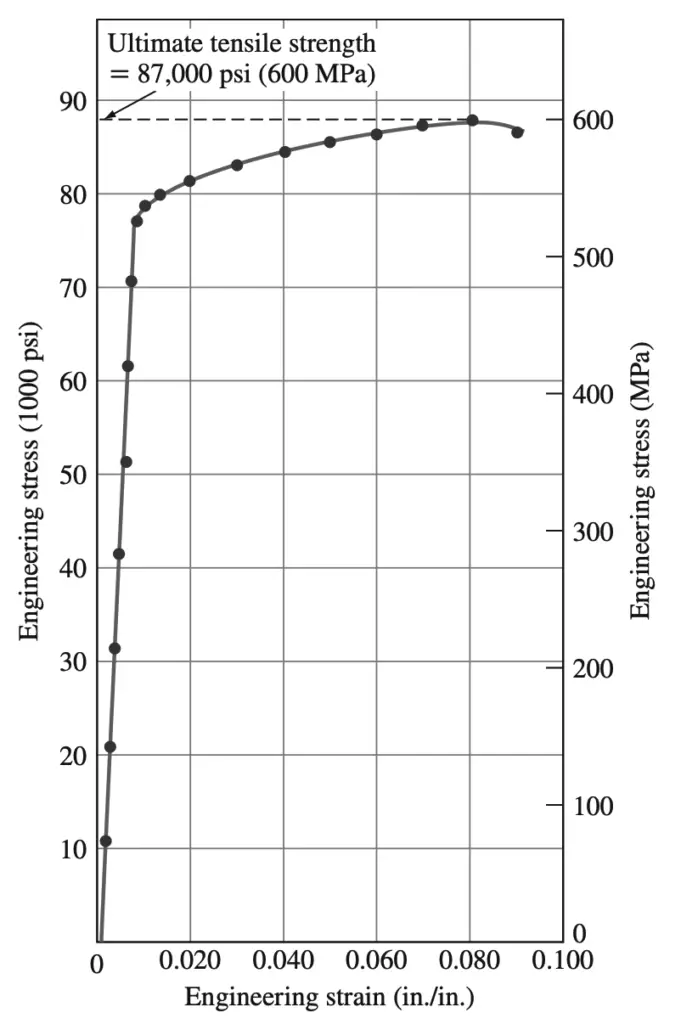
The force data obtained from the chart paper for the tensile test can be converted to normal engineering stress data, and a plot of normal engineering stress versus normal engineering strain can be constructed. The below figure shows an engineering stress-strain diagram for a high-strength aluminum alloy.
Mechanical Property Data Obtained from the Tensile Test and the Engineering Stress Strain Diagram
The mechanical properties of metals and alloys that are of engineering importance for structural design and can be obtained from the engineering tensile test are:
- Modulus of elasticity
- Yield strength at 0.2% offset
- Ultimate tensile strength
- Percent elongation at fracture
- Percent reduction in area at fracture
- Modulus of resilience
- Toughness (static)
1. Modulus of Elasticity
In the first part of the tensile test, the metal is deformed elastically. That is, if the load on the specimen is released, the specimen will return to its original length. For metals, the maximum elastic deformation is small and usually less than 0.5% (0.005).
In general, metals and alloys show a linear relationship between stress and strain in the elastic region of the engineering stress-strain diagram, which is described by Hooke’s law:
Stress (σ)= E × Strain (ϵ)
E = Stress (σ) / Strain (ϵ)
Where E is the modulus of elasticity or Young’s modulus and units are of psi or Pa.
The modulus of elasticity is a measure of stiffness or rigidity (resistance to elastic deformation) of the metal and is related to the bonding strength between atoms in a metal or alloy. The following table lists the elastic moduli for some common metals.
| Material | Modulus of Elasticity 106 psi (GPa) |
| Aluminum alloys | 10.5 (72.4) |
| Copper | 16.0 (110) |
| Steel (plain carbon and low-alloy) | 29.0 (200) |
| Stainless steel (18-8) | 28.0 (193) |
| Titanium | 17.0 (117) |
| Tungsten | 58.0 (400) |
Metals with high elastic moduli are relatively stiff and do not undergo elastic deformation easily. Steels, for example, have high elastic moduli values of 30 × 106 psi (207 GPa),7 whereas aluminum alloys have lower elastic moduli of about 10 to 11 × 106 psi (69 to 76 GPa). Note that in the elastic region of the stress-strain diagram, the modulus does not change with increasing stress.
2. Yield Strength
The yield strength (YS or σy) is a very important value for use in engineering structural design since it is the stress at which a metal or alloy shows significant plastic deformation. Because there is no definite point on the stress-strain curve where elastic strain ends and the plastic strain begins, the yield strength is chosen to be that stress at which a specific amount of strain is observed.
For American engineering structural design, the yield strength is chosen as the value of stress when 0.2% plastic strain has taken place, as indicated on the engineering stress-strain diagram of Figure below. The 0.2% yield strength, also called the 0.2% offset yield strength, is determined from the engineering stress-strain diagram, as shown below figure.
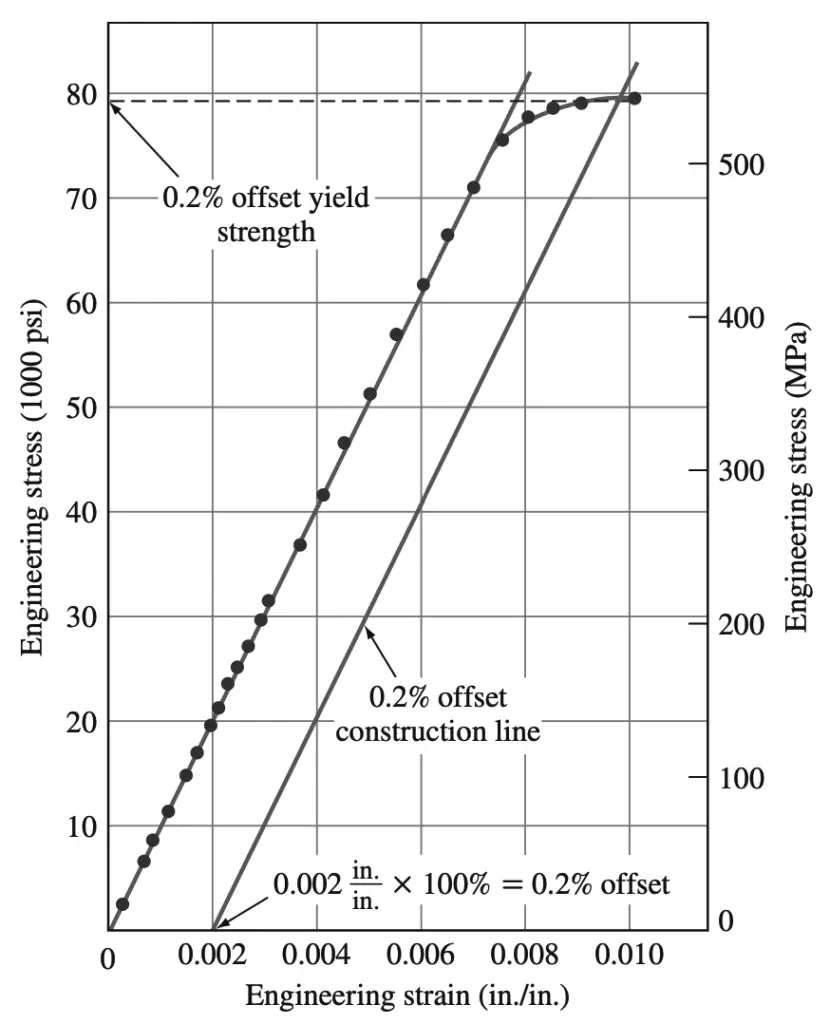
First, a line is drawn parallel to the elastic (linear) part of the stress-strain plot at 0.002 in./in. (m/m) strain, as indicated in the above figure. Then at the point where this line intersects the upper part of the stress-strain curve, a horizontal line is drawn to the stress axis.
The 0.2% offset yield strength is the stress where the horizontal line intersects the stress axis, and in the case of the stress-strain curve of the stress-strain diagram, the yield strength is 78,000 psi. It should be pointed out that the 0.2% offset yield strength is arbitrarily chosen, and thus the yield strength could have been chosen at any other small amount of permanent deformation.
For example, a 0.1% offset yield strength is commonly used in the United Kingdom.
3. Ultimate Tensile Strength
The ultimate tensile strength (UTS or σu) is the maximum strength reached in the engineering stress-strain curve. When one wishes to know which metals are stronger, it is generally the ultimate tensile strengths that are compared. For ductile metals, the specimen develops a localized decrease in the cross-sectional area around the UTS point (commonly called necking).
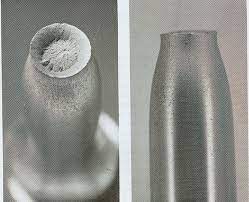
The above image shows the end stages of the necking process. Once the necking process begins, the engineering stress-strain curve will begin to dip down until fracture occurs. The dip in the engineering stress-strain curve is a result of the actual reduction in the cross-sectional area of the specimen producing large stresses at the same load, while the engineering stress is determined by using the original cross-sectional area of the specimen.
In other words, the stress in the specimen continues to increase up to the stress at fracture. It is only because we use the original cross-sectional area to determine engineering stress that the stress on the engineering stress-strain diagram decreases at the latter part of the test. The more ductile metal is, the more the specimen will neck before fracture, and hence the more the decrease in the stress on the stress-strain curve beyond the maximum stress.
For the high-strength aluminum alloy whose stress-strain curve is shown in the above Stress-strain diagram, there is only a small decrease in stress beyond the maximum stress because this material has relatively low ductility. The ultimate tensile strength of a metal is determined by drawing a horizontal line from the maximum point on the stress-strain curve to the stress axis. The stress where this line intersects the stress axis is called the ultimate tensile strength, or sometimes just the tensile strength.
For the aluminum alloy of the Stress-strain diagram, the ultimate tensile strength is 87,000 psi. The ultimate tensile strength is not used much in engineering design for ductile alloys since too much plastic deformation takes place before it is reached. However, the ultimate tensile strength can give some indication of the presence of defects. If the metal contains porosity or inclusions, these defects may cause the ultimate tensile strength of the metal to be lower than normal.
4. Percent Elongation
The amount of elongation that a tensile specimen undergoes during testing provides a value for the ductility of a metal. Ductility of metals is most commonly expressed as percent elongation, starting with a gage length usually of 2 in. (5.1 cm). In general, the higher the ductility (the more deformable the metal is), the higher the percent elongation.
For example, a sheet of 0.062-in. (1.6-mm) commercially pure aluminum (alloy 1100-0) in the soft condition has a high percent elongation of 35%, whereas the same thickness of the high-strength aluminum alloy 7075-T6 in the fully hard condition has a percent elongation of only 11%.
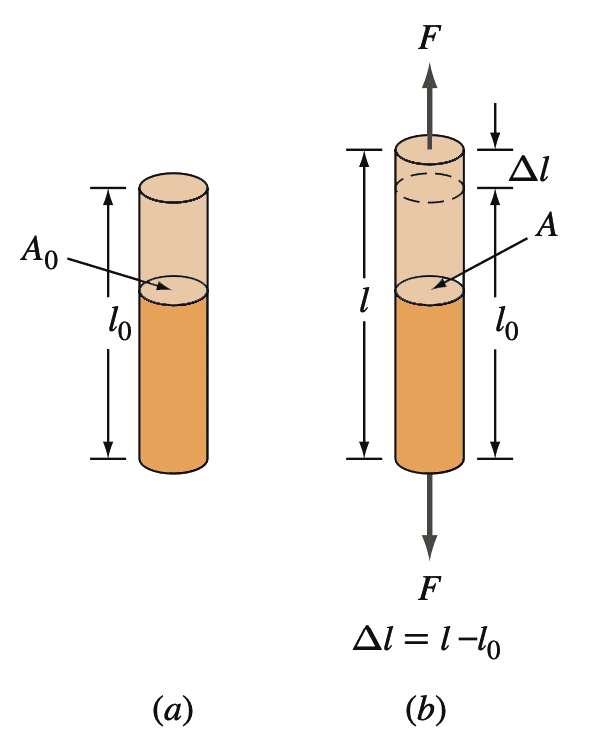
As previously mentioned, during the tensile test an extensometer can be used to continuously measure the strain of the specimen being tested. However, the percent elongation of a specimen after fracture can be measured by fitting the fractured specimen together and measuring the final elongation with calipers. The percent elongation can then be calculated from the equation.
Engineering strain ϵ (normal strain) = (l − l0) / l0
where
l0 = original length of sample
l = new length of sample after being extended by a uniaxial tensile force.
% elongation = engineering strain × 100%
The percent elongation at fracture is of engineering importance not only as a measure of ductility but also as an index of the quality of the metal. If porosity or inclusions are present in the metal or if damage due to overheating the metal has occurred, the percent elongation of the specimen tested may be decreased below normal.
5. Percent Reduction in Area
The ductility of a metal or alloy can also be expressed in terms of the percent reduction in area. This quantity is usually obtained from a tensile test using a specimen 0.50 in. (12.7 mm) in diameter. After the test, the diameter of the reduced cross-section at the fracture is measured. Using the measurements of the initial and final diameters, the percent reduction in area can be determined from the equation
% reduction in area = initial area − final area/ initial area × 100%
% reduction in area = A0 − Af /A0× 100%
The percent reduction in area, like the percent elongation, is a measure of the ductility of the metal and is also an index of quality. The percent reduction in the area may be decreased if defects such as inclusions and/or porosity are present in the metal specimen.
6. Modulus of Resilience
The modulus of resilience, Ur, is the amount of energy absorbed by a loaded material just prior to yielding. This energy is fully recovered once the load is removed. This property can be determined by calculating the area under the linear-elastic portion of the engineering stress-strain diagram using the following equation.
Ur = 1/2 σy εy
The units of the modulus of resilience will be in terms of energy per unit volume.
J/m3 or Nm/m3 (lb·in/in3) or N/m2 (lb/in2)
7. Toughness
The modulus of toughness is used to describe a combination of strength and ductility behaviors. Materials with high strength and ductility will be tougher than those with lower strength and/or ductility. The modulus of toughness is determined by calculating the area under the full stress-strain curve. One can define the modulus of toughness as the amount of energy per unit volume required to bring a sample to fracture in a tensile test.
Let us solve an example problem to calculate the modulus of resilience Ur and the toughness of the material from a given Stress-strain diagram.
Example problem to Calculate modulus of resilience and the toughness
Problem Statement: For the given engineering stress-strain diagram, please find the modulus of resilience Ur and the toughness of the material.
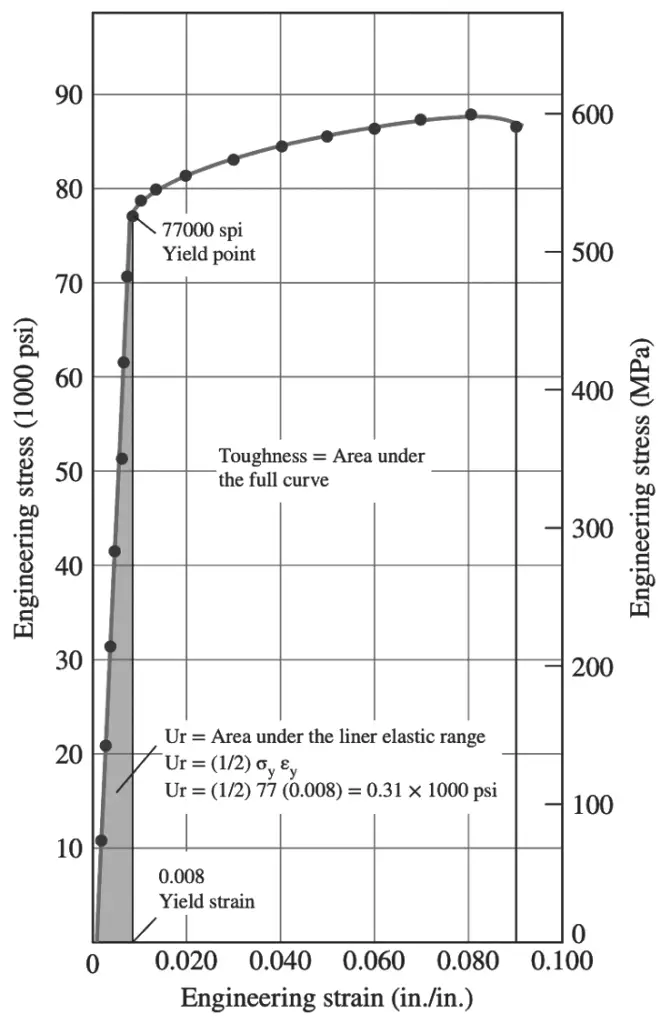
The modulus of resilience Ur is equal to the area under the linear elastic range of the stress-strain diagram. This area can be estimated by the above modulus of the resilience equation.
Based on the preceding diagram, the yield strength σy can be estimated as 77,000 psi, yield strain σy can be estimated as 0.008.
Ur = 1/ 2 σy εy
Ur = 1/2 (77, 000 psi)(0.008)
Ur = 0.3 × 1000 psi
Ur = 300 psi
The toughness of the materials can be estimated by measuring the area under the full stress-strain curve.
If one estimates the total number of white squares under the stress-strain curve as 32 squares, and knowing that the area of each square is 200 psi (10,000 × 0.02), one can estimate the white area as 6400 psi.
Therefore the total area or toughness of the material will be estimated at 6700 psi or (lb.in.)/in.3 (300 + 6400). This value represents the amount of energy per unit volume required to bring a sample to fracture in static tension.
The percent reduction in area, like the percent elongation, is a measure of the ductility of the metal and is also an index of quality. The percent reduction in the area may be decreased if defects such as inclusions and/or porosity are present in the metal specimen.
Comparing Engineering Stress-Strain Curves for Selected Alloys
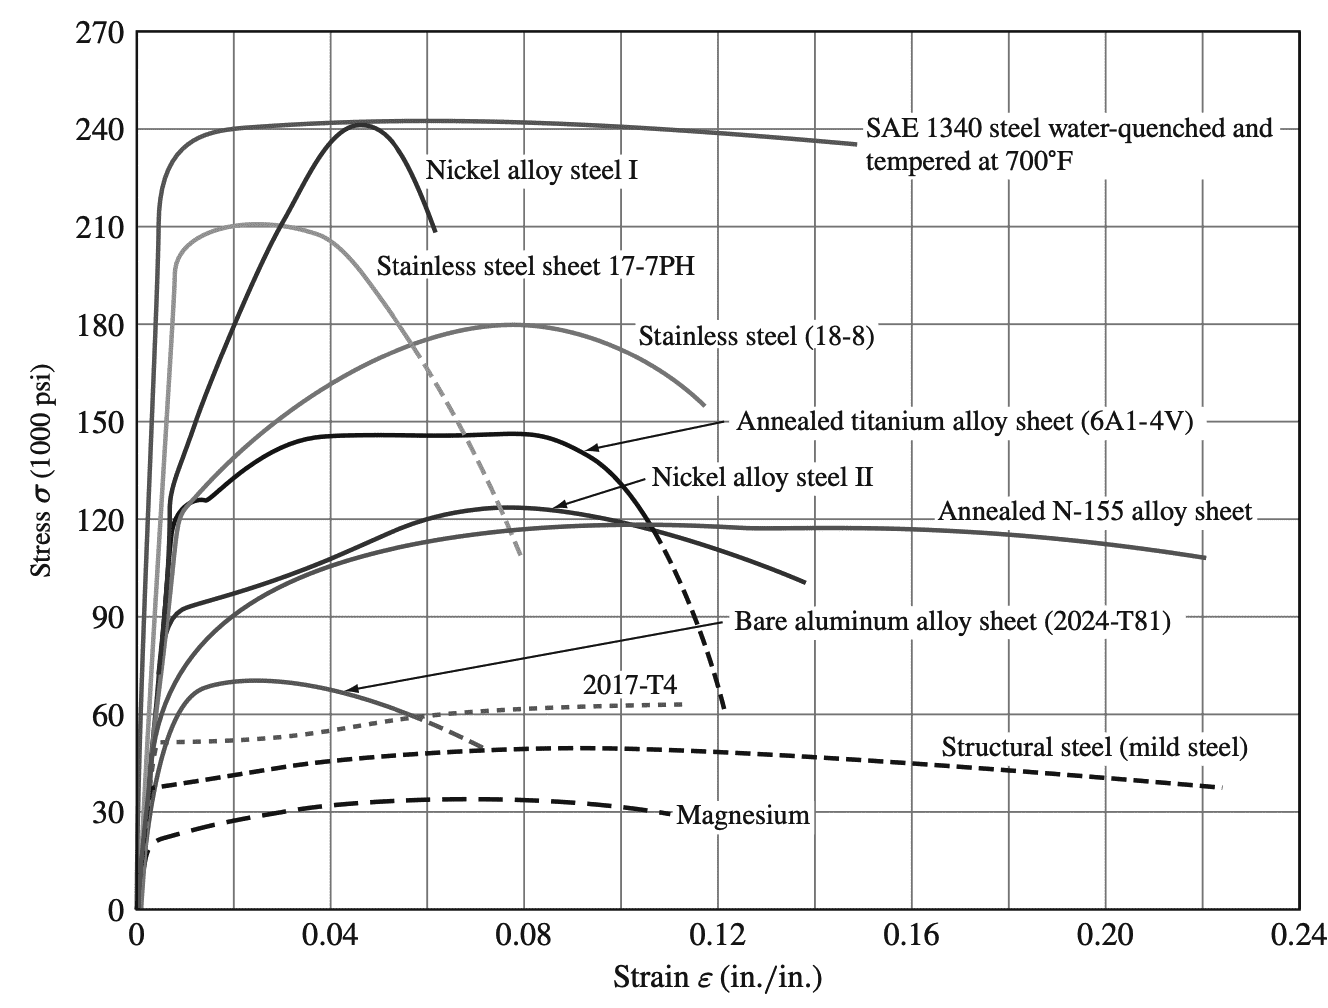
Engineering stress-strain curves for selected metals and alloys are shown above Alloying a metal with other metals or nonmetals and heat treatment can greatly affect the tensile strength and ductility of metals.
The stress-strain curves for different metals and alloys show a great variation in ultimate tensile strength.
Elemental magnesium has a UTS of 35 ksi (1 ksi = 1000 psi), whereas SAE 1340 steel water-quenched and tempered at 700°F (370°C) has a UTS of 240 ksi.
Conclusion
We have discussed what is engineering stress-strain curve is and discussed how it is drawn from the tensile test. also solved an example problem to calculate the toughness and modulus of resilience from the stress-strain curve. The mechanical properties data from the tensile test and the Stress-strain curve. Also given the Engineering stress strain curve for the commonly used metals and alloys. Other related topics under stress-strain are the as follows
- Engineering Stress and Engineering Strain
- Principal Stresses and principal Planes
- Torsional Stress
- Bearning Stress
- Bending Stress
- Shear stress
- Stress Concentration
- Methods of Reducing Stress Concentration
Let us know what do you think about this article in the comment section below.
Leave a Reply