When a metal or an alloy is under a constant load or stress, it may undergo progressive plastic deformation over a period of time. This time-dependent strain is called creep. The Stress Rupture of Metals referred to the sudden and complete failure of a material under stress when there is a constant loading of the metals. Let us see more details about what is Creep and Stress Rupture of metals with testing.
Creep in Metals
As we mentioned above, creep is the progressive plastic deformation of metals under constant load or stress with respect to time. In engineering words, the time-dependent strain is called the Creep of metal.
The creep of metals and alloys is very important for some types of engineering designs, particularly those operating at elevated temperatures such as jet turbine blades or steam pipes.
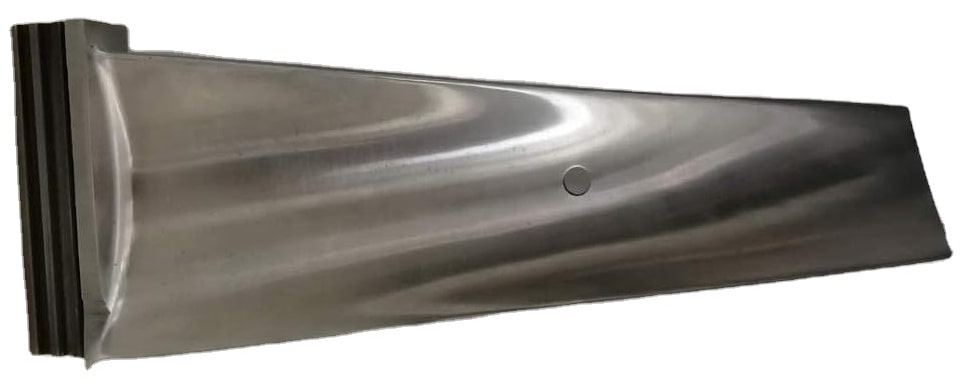
For example, let us say an engineer selecting an alloy for the turbine blades of a gas turbine engine must choose an alloy with a very low creep rate so that the blades can remain in service for a long period of time before having to be replaced due to their reaching the maximum allowable strain.
For many engineering designs operating at elevated temperatures, the creep of materials is the limiting factor with respect to how high the operating temperature can be.
Typical Creep Curve for a Metal
Let us consider the creep of pure polycrystalline metal at a temperature above one-half its absolute melting point, (1/2)TM (high-temperature creep).
Let us also consider a creep experiment in which an annealed tensile specimen is subjected to a constant load of sufficient magnitude to cause extensive creep deformation. When the change of length of the specimen over a period of time is plotted against time increments, a creep curve, such as the one shown below in graph 1 is obtained.
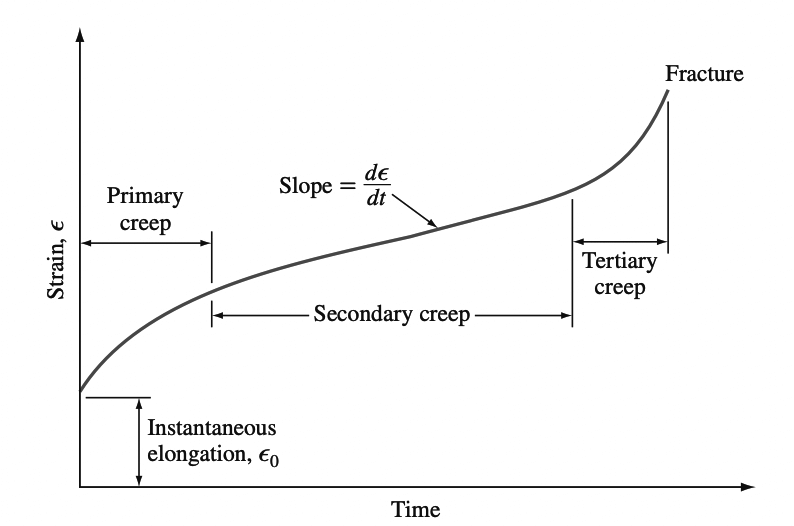
The curve represents the time-versus-strain behavior of a metal or alloy under a constant load at a constant temperature. The second stage of creep (linear creep) is of most interest to the design engineer because extensive creep occurs under these conditions.
In the idealized creep curve of, as shown above, there is first an instantaneous, rapid elongation of the specimen, Є0.
- Following this, the specimen exhibits primary creep in which the strain rate decreases with time. The slope of the creep curve (dЄ/dt, or Є) is designated the creep rate. Thus, during primary creep, the creep rate progressively decreases with time.
- After primary creep, the second stage of creep occurs in which the creep rate is essentially constant and is therefore also referred to as steady-state creep.
- Finally, a third or tertiary stage of creep occurs in which the creep rate rapidly increases with time up to the strain at fracture. The shape of the creep curve depends strongly on the applied load (stress) and temperature. Higher stresses and higher temperatures increase the creep rate.
Understanding Stages in Creep Curve
1. Primary Stage in Creep Curve: During primary creep, the metal strain hardens to support the applied load and the creep rate decreases with time as further strain hardening becomes more difficult.
2. Secondary Stage in Creep Curve: At higher temperatures above about 0.5TM for the metal during secondary creep, recovery processes involving highly mobile dislocations counteract the strain hardening so that the metal continues to elongate (creep) at a steady-state rate as shown in the above creep curve.
The slope of the creep curve (dЄ/dt = Є) in the secondary stage of creep is referred to as the minimum creep rate. During secondary creep, the creep resistance of the metal or alloy is the highest.
3. Tertiary stage in Creep Curve: Finally, for a constant-loaded specimen, the creep rate accelerates in the tertiary stage of creep due to the necking of the specimen and also to the formation of voids, particularly along grain boundaries. The below figure shows intergranular cracking in a type 304L stainless steel that has undergone creep failure.

At low temperatures below 0.4TM and low stresses, metals show primary creep but negligible secondary creep since the temperature is too low for diffusional recovery creep. However, if the stress on the metal is above the ultimate tensile strength, the metal will elongate as in an ordinary engineering tensile test. In general, as both the stress on the metal undergoing creep and its temperature are increased, the creep rate is also increased. This is illustrated in the below Creep Curve Graph 2.
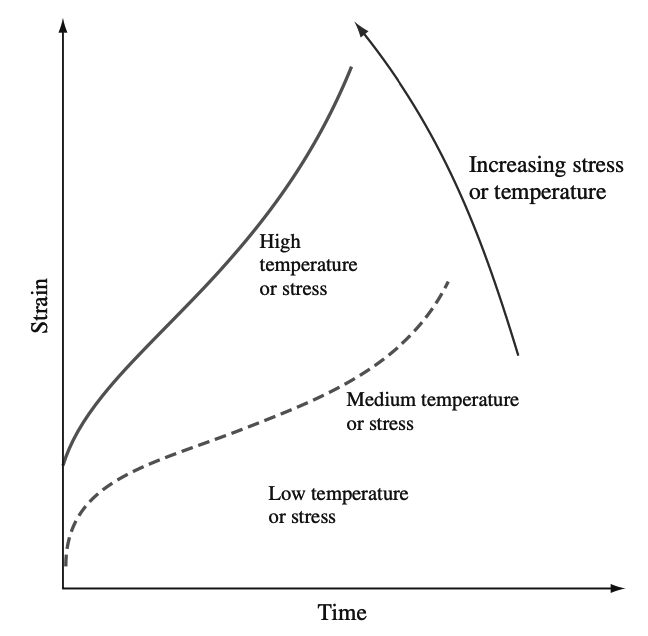
Note that as the stress increases, the strain rate increases.
The slope of the linear part of the curve is the steady-state creep rate in above Graph 3.
Creep Test Data
The effects of temperatures and stress on the creep rate are determined by the creep test. Multiple creep tests are run using different stress levels at constant temperature or different temperatures at constant stress, and the creep curves are plotted as shown below in graph 3.
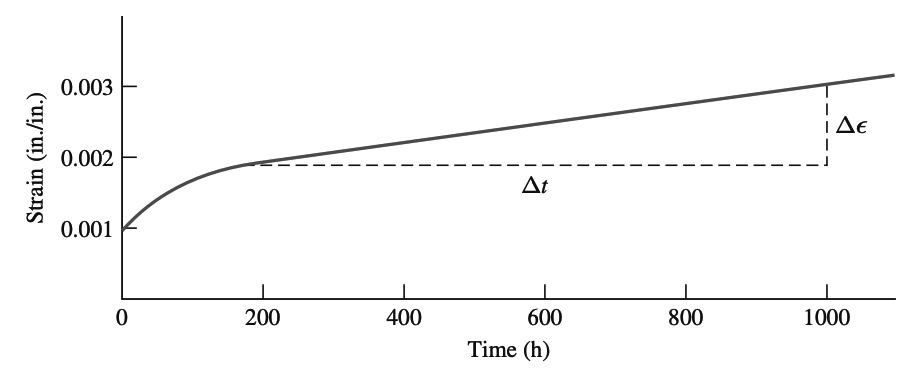
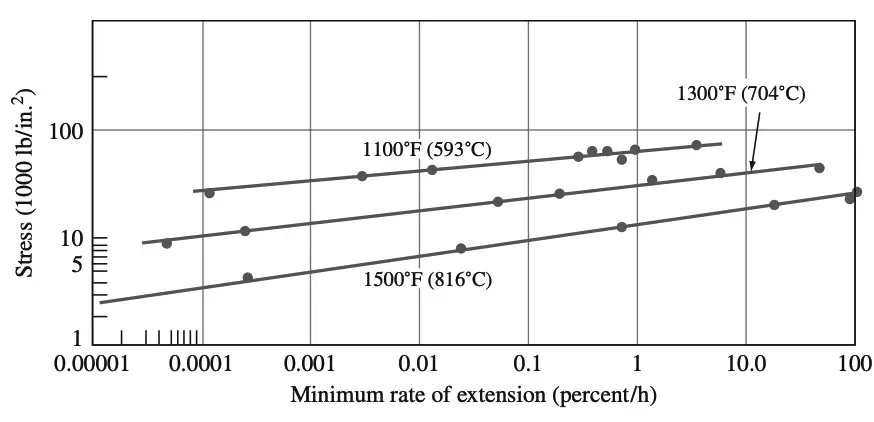
The minimum creep rate or slope of the second stage of the creep curve is measured for each curve, as indicated in the above graph. The stress to produce a minimum creep rate of 10−5 percent/h at a given temperature is a common standard for creep strength.
In the below graph 4, the stress to produce a minimum creep rate of 10−5 percent/h for type 316 stainless steel can be determined by extrapolation.
Let us solve an example problem on how to calculate the Creep rate for Copper Alloy as shown in above graph 3.
Example problem to find Creep Rate
Determine the steady-state creep rate for the copper alloy whose creep curve is shown in above graph 3.
Answer:
The steady-state creep rate for this alloy for the creep curve shown in graph 3 is obtained by taking the slope of the linear part of the curve as indicated in the graph. Thus,
Creep rate = ΔЄ / Δt
= (0.0029 − 0.0019) / (1000h − 200h)
= (0.001 in./in) / (800h)
= 1.2 × 10⁻⁶ in./in./h
Creep – Rupture Test Data
The creep-rupture or stress-rupture test is essentially the same as the creep test except that the loads are higher and the test is carried out to the failure of the specimen. Creep-rupture data are plotted as log stress versus log rupture time, as shown in graph 5.
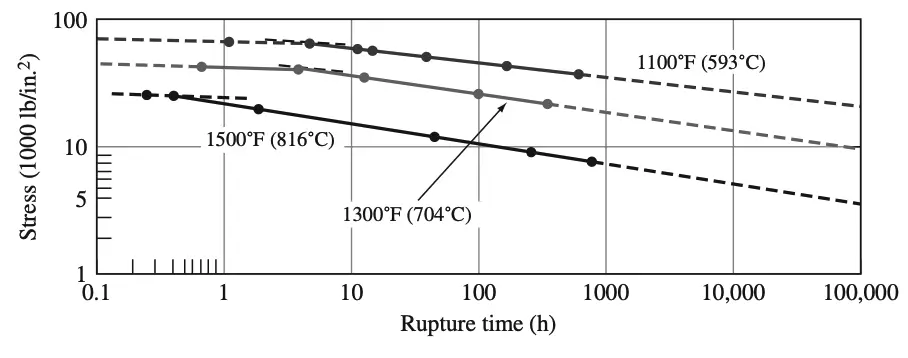
In general, the time for stress rupture to occur is decreased as the applied stress and temperature are increased. Slope changes as observed in the above graph 5 are caused by factors such as recrystallization, oxidation, corrosion, or phase changes.
Conclusion
We have discussed the Creep in metals and discussed the different stages of creep with help of a typical creep curve for alloy metals. Also given some of the test data for copper alloys and stainless steel creep rate data and solved an example problem to find out the creep rate of copper alloy. Among the other material failures, Fracture failure, and fatigue failure and Creep failure are observed in the testing stage of prototypes. All these concepts are very important for every design engineer should have a deep understanding of.

Leave a Reply