Fatigue failure refers to the failure of the machine component due to repeated or cyclic loading. Due to the fluctuation in the stress, this failure occurs. This Fatigue Failure process starts with the Crack initiation due to the repeated cyclic loads. This crack propagates and leads to the Final fatigue failure. This Fatigue failure is explained in detail in the previous article. Let us understand the Fatigue Crack propagation rate.
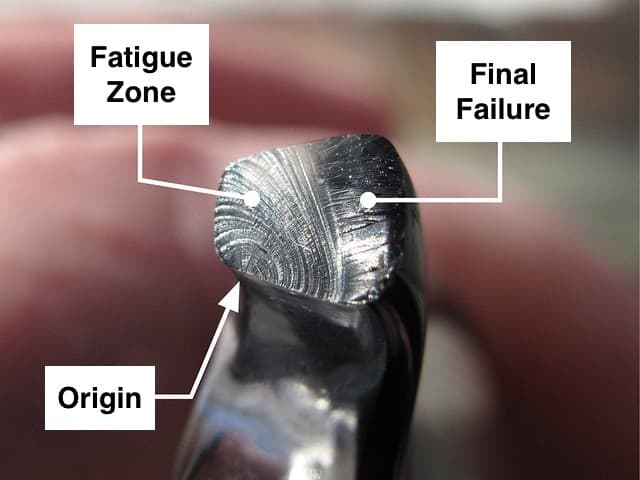
Fatigue Crack Propagation Rate
Most fatigue data for metals and alloys for high-cycle fatigue. that is fatigue lives of greater than 104 to 105 cycles have been concerned with the nominal stress required to cause failure in a given number of cycles, that is SN curves such as those shown in the below SN curve.
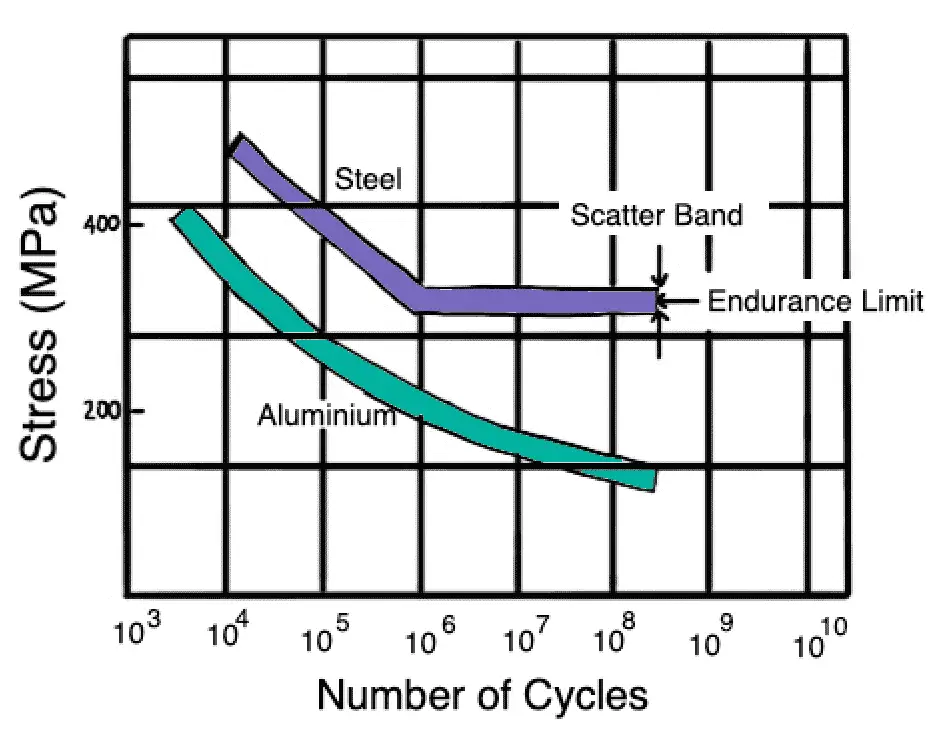
However, for these tests smooth or notched specimens are usually used, and thus it is difficult to distinguish between fatigue crack initiation life and fatigue crack propagation life. Thus, test methods have been developed to measure fatigue life associated with preexisting flaws in a material.
Pre-existing flaws or cracks within a material component reduce or may eliminate the crack initiation part of the fatigue life of a component. Thus, the fatigue life of a component with preexisting flaws may be considerably shorter than the life of one without flaws. In this section, we will utilize fracture mechanics methodology to develop a relationship to predict fatigue life in a material with preexisting flaws and under stress-state conditions due to cyclic fatigue action.
Correlation of Fatigue Crack Propagation with Stress and Crack Length
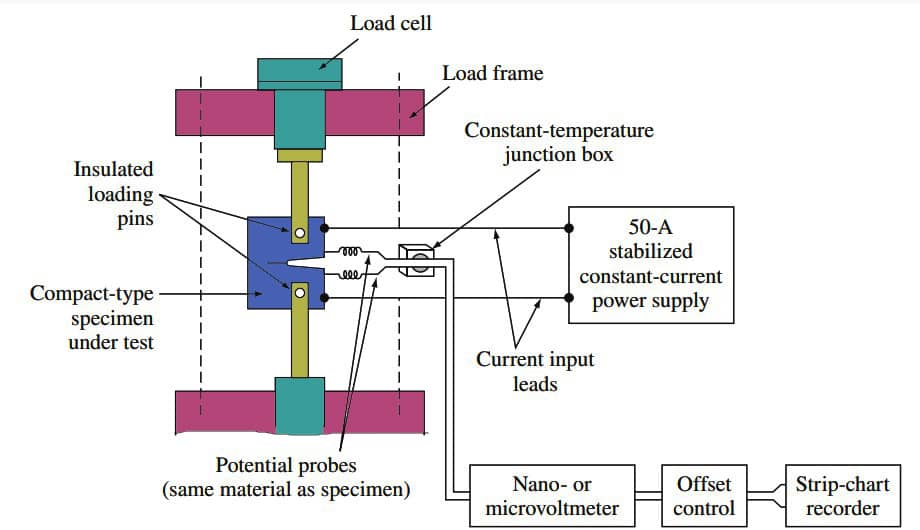
Let us now consider qualitatively how fatigue crack length varies with an increasing number of applied cyclic stresses using data obtained from an experimental setup such as that shown below figure.
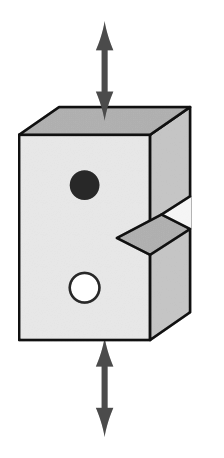
Let us use several test samples of a material each of which has a mechanical crack in its side as indicated in the below figure.
Now let us apply constant amplitude cyclic stress to the samples and measure the increase in crack length as a function of the number of applied stress cycles. The below figure shows qualitatively how a plot of crack length versus the number of stress cycles for two levels of stress might appear for a particular material such as mild steel.
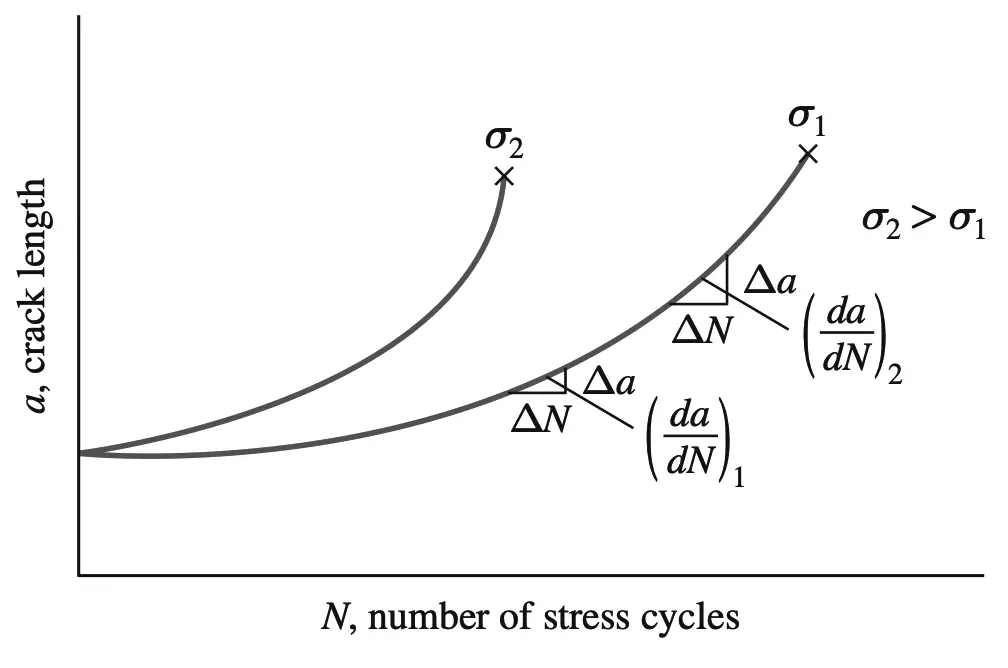
Examination of the curves of the above graph indicates the following:
- When the crack length is small, the fatigue crack growth rate da/dN is also relatively small.
- The crack growth rate da/dN increases with increasing crack length.
- An increase in cyclic stress σ increases the crack growth rate.Thus, the crack growth rate for materials under cyclic stress that behave as indicated in the above graph shows the following relationship:
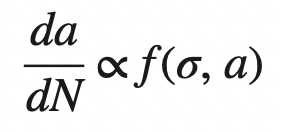
which reads, “the fatigue crack growth rate da/dN varies as a function of the applied cyclic stress σ and the crack length a.” After much research, it has been shown that for many materials the fatigue crack growth rate is a function of the stress intensity factor K (mode I) of fracture mechanics, which itself is a combination of stress and crack length. For many engineering alloys, the fatigue crack growth rate expressed as the differential da/dN can be related to the stress-intensity range ΔK for constant amplitude fatigue stress by the equation
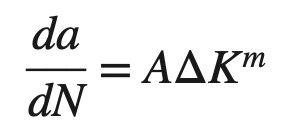
where
da/dN = fatigue crack growth rate, mm/cycle or in./cycle
ΔK = stress-intensity factor range (ΔK = Kmax − Kmin), MPa√ m or ksi√in.
A, m = constants that are a function of the material, environment, frequency, temperature, and stress ratio
Important Note: In the above Equation, we used the Stress intensity facto KI (pronounced “Kay-one”) for mode 1.
Not the critical stress intensity factor KIC (pronounced “kay-one-see”) called the Fracture toughness. It should not be confused. It needs to be understood from here.
We know the stress intensity factor for Mode 1
KI = σ √(πa)
KI = stress-intensity factor
σ = applied nominal stress
a = edge crack length or half the length of an internal through the crack
Thus, at the maximum cyclic stress, the stress-intensity factor
Kmax = σmax√πa,
And at the minimum cyclic stress,
ΔKmin = σmin√πa.
For the range of stress-intensity factors,
ΔK(range) = Kmax − Kmin = ΔK = σmax√πa − σmin √πa = σrange√πa.
Since the stress-intensity factor is not defined for compressive stresses, if σmin is in compression, Kmin is assigned a zero value.
If there is a Y geometric correction factor for the ΔK = σr√πa equation, then ΔK = Yσr√πa
Fatigue Crack Growth Rate versus Stress-Intensity Factor Range Plots
Usually, fatigue crack length versus stress-intensity factor range data is plotted as log da/dN versus log stress-intensity factor range ΔK.
These data are plotted as a log-log plot since in most cases a straight line or close to a straight-line plot is obtained. The basic reason for the straight-line plot is that the da/dN versus ΔK data closely obey the da/dN = AΔKm relationship, and so if the log is taken of both sides of this equation, we obtain

We can re-write this as follows.

which is an equation of a straight line of the form y = mx + b.
Thus, a plot of log (da/dN) versus log ΔK produces a straight line with a slope of m.
The following graph shows a plot of log crack growth rate versus log stress-intensity factor range for a fatigue test of an ASTM A533 B1 steel.
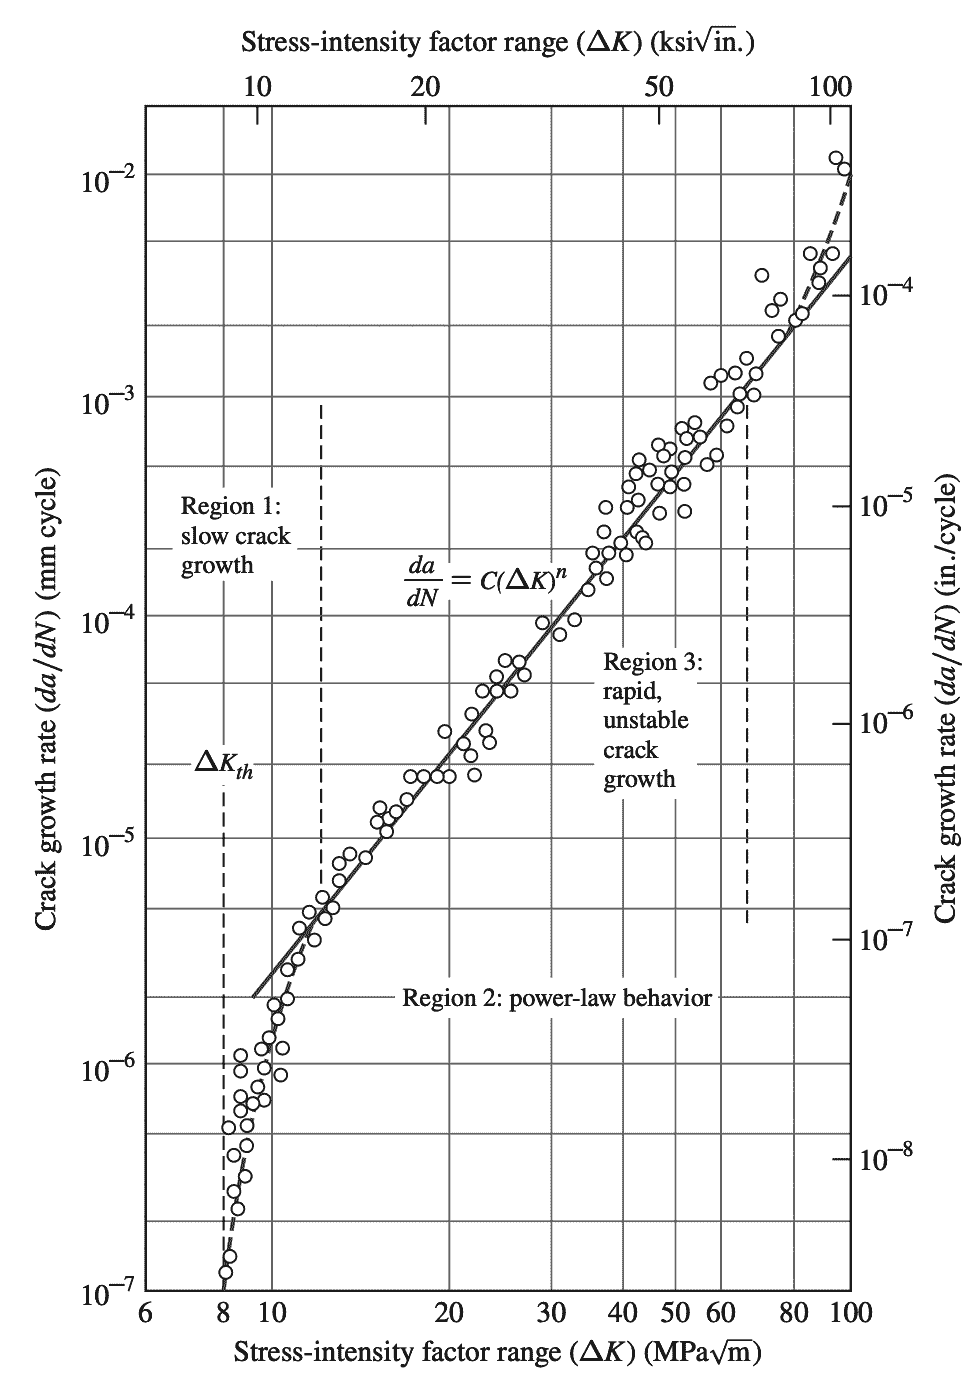
(yield strength 470 MPa [70 ksi]). Test conditions: R = 0.10: ambient room air, 24°C
This Fatigue Crack propagation rate plot is divided into three regions.
- Region 1 in which the fatigue crack growth rate is very slow.
- Region 2 in which the plot is a straight line represented by the power-law da/dn = AΔKm
- Region 3 in which rapid unstable crack growth takes place, approaching failure of the sample.
The limiting value of ΔK below which there is no measurable crack growth is called the stress-intensity factor range threshold ΔKth. No crack growth should occur below this stress-intensity range level. The value of m for fatigue crack growth da/dN in region 2 usually varies from about 2.5 to 6.

Leave a Reply