In the course of Product Design and Development, the Technology S-Curve determines the performance in regards to time and effort. It assists in determining the level of maturity of the industry/product. Let us discuss more details on the Technology S-Curves.

Technology S-Curve
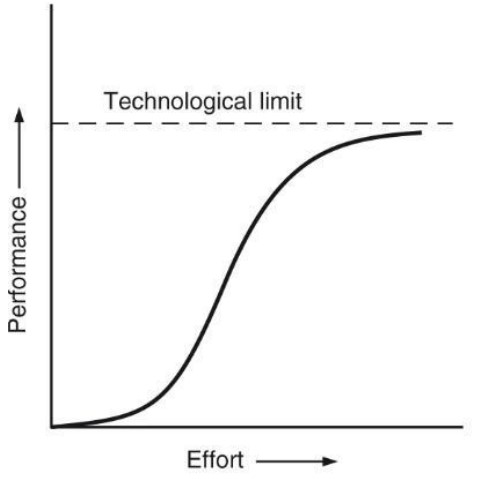
When evaluating a product or an industry, it is crucial to understand where it is on the S-curve due to the many implications that result out of that such as the possible risks and pitfalls that are associated for certain phases on it.
Technological innovation time cycle and market behaviour are well characterized by the ‘S’ curve. Technological innovation typically manifests themselves into a market along the ‘S’ curve. In case of product, the Product Metric (In the case of the bulb, lumens of light output per unit watt; efficiency) can be plotted as a function of time when each product was introduced. The metric value will naturally fall as an ‘S- curve’ in time.
Stages of Technology S-Curve
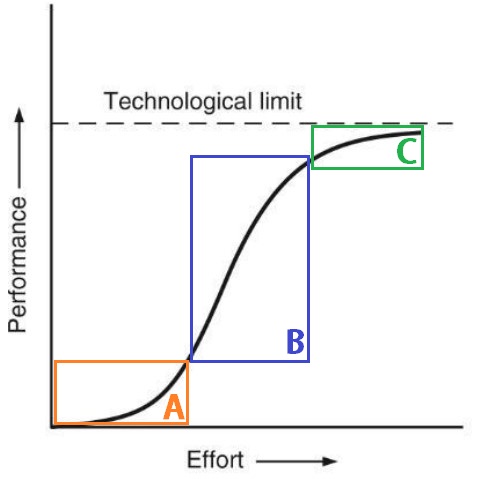
A – Lower portion
- This phase is in the beginning of the S-Curve pattern of innovation.
- It is when the product/ industry is completely new.
- As a result, a dominant design in the market hasn’t been established yet.
- Therefore, the competition between the various players in the industry is fierce.
- As a result, usually at this stage, most of the resources are spent on research and development.
- There will be apparently not much innovation.
- Changes are less and widely spaced
B – Middle portion
- In this phase, due to the ability to overcome a major technical obstacle or the ability to satisfy a demand of the market.
- The product/industry has been adopted by the early majority and managed to cross the differences and a dominant design has been established already.
- Hence, the market will be characterized by rapid growth in production, and the product will move quickly towards a full market acceptance.
- So, A rapid profusion of innovation (slope) will take place during this period.
- Many products are launched and many competitors join the market.
C – Top portion (Maturity)
- Here, the product is adopted almost completely by society and is usually approaching a physical limit.
- Due to the strong competition among the major players in the market which is clearly defined at this stage, most of the resources at this point are spent on improving the production processes and making them cheaper.
- Therefore, oftentimes the products at this stage become completely standardized and the innovations at this stage are considered incremental.
Discontinuity in S-Curve
Usually, when the innovation in the product reaches its maturity level, there might be a change in the technology which disrupts the industry or the market by its new technology. So thereby a new S-curve starts.
When the new S-Curve starts, there will be a discontinuity in between the two S-Curves.
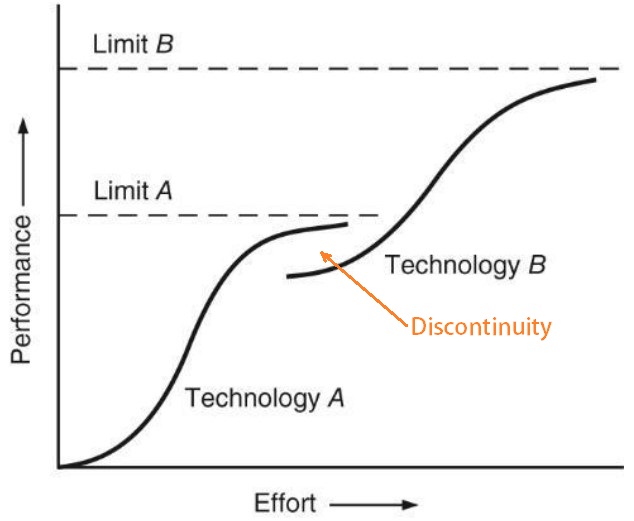
- At this phase of discontinuity, the innovation occurs, as a new S-Curve pattern can rise.
- Since the previous product reaches an era of maturity, there is an opportunity for a new product to appeal to the innovator’s segment and they will start a new product life cycle which is usually considered as the Disruption.
- Obviously, there is an opportunity for additional S-Curves as the market progresses (as occurred in the publishing industry with the Kindle.
Example – The Audio Industry
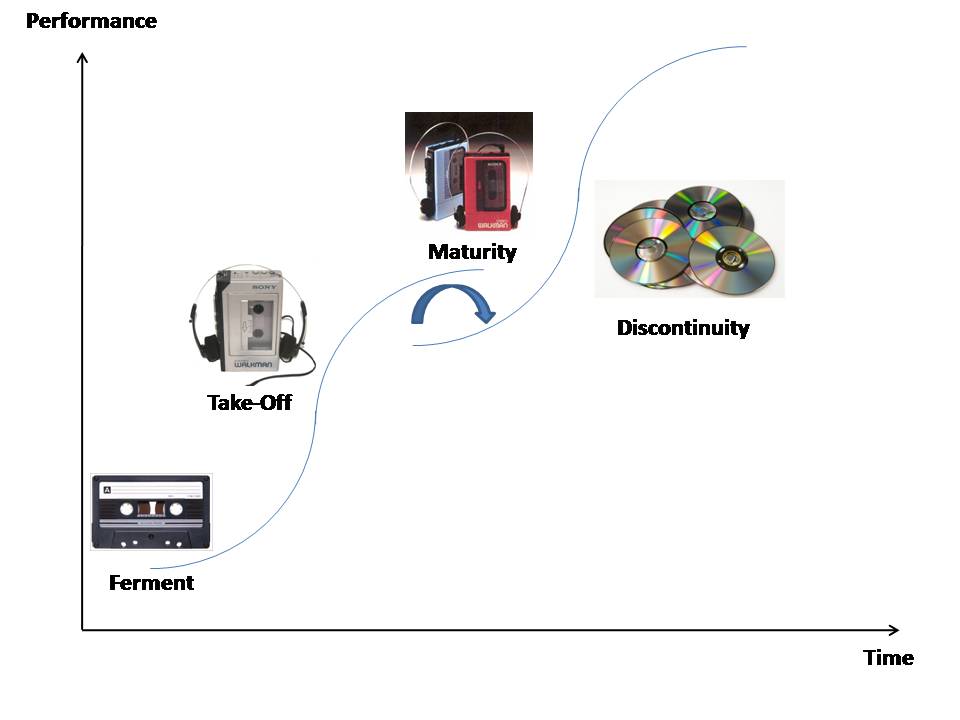
- To understand the concept of the S-Curve Better, let’s use the audio industry as an example.
- At the start, at the fermenting stage, there was the Cassette tape which was invented by Phillips.
- Then, at the Takeoff phase, Sony has invented the Walkman that had the ability to answer the customers’ demand of listening to their Cassette outside.
- As a result of Sony’s success, the market has arrived at its maturity as a number of competitors manufactured similar devices (Phillips, Sony, TDK, Maxwell, etc.)
- The Discontinuity phase appeared when Sony and Phillips have developed the compact disk and by doing so, disrupted the market and started a new S-Curve.
Conclusion
The Technology S-Curve of Innovation/product life cycle is a robust framework that can be used to analyze various products at their different stages and to explain their successes and failures. If you still have any further thoughts on this topic, please let us know in the comment section below.

Leave a Reply