A Final Project on “Comparative Study Of Individual Investors: Physical Assets Vs Financial Assets” was submitted by Adhavan.V (from Sri Krishna Arts and Science College, Coimbatore, INDIA 641008) to extrudesign.com.
Abstract
The financial position of a country largely depends on the inflation rate, foreign exchange rate, per capita Gross domestic product, etc. Savings from middle-class households also plays a vital role in improving the financial position of a country as it leads to more investments and capital formation in the economy. Savings and investments are directly proportionate to each other. An investment is an asset or item that is purchased with the hope that it will generate income or appreciate in the future. In an economic sense, an investment is the purchase of goods that are not consumed today but are used in the future to create wealth. In finance, an investment is a monetary asset purchased with the idea that the asset will provide income in the future or appreciate and be sold at a higher price. Investment refers to the commitment of funds at present, in anticipation of some positive rate of return in future. Today the spectrum of investment is indeed wide. An investment is confronted with an array of investment avenues like Equity share, Mutual fund, Public Provident Fund, Bank Deposits/ FD, Gold/Silver, Insurance, Real Estate, National Pension scheme. Among all investments, investment in banks deposits, Public Provident funds are safest and most preferred by individuals and in equity proportionately are most profitable. India economies doing indeed well in recent years.
Keywords: Individual investors, Physical assets, Financial assets, Risk and return, Mutual funds.
1. Introduction
1.1 Overview of the Study:
The term investment ‟signifies a commitment of funds for a fruitful purpose. Fischer and Jordan rightly defined investment as “a commitment of funds made in the expectations of some positive rate of return. If the investment is positively undertaken, the return will be commensurate with the risk the investor assumes”. The activity of investment involves the judicious and proper employment of funds intending to achieve additional income or growth in values. Investment also involves a commitment of resources, which have been saved in the hope that some benefits will accrue in future. The essential quality of an investment is that it involves waiting for a reward. Investing entails a continuous flow of decisions that cannot be avoided. All investment choices are made at different points of time and in contemplation of an uncertain future. Investors will reappraise from time to time and review their various investment commitments in the light of new information and changed expectations. The investors reinforce their bargaining position by analyzing the investment opportunities available in the market. Thus, individual investors choose investment avenues considering their needs for investing out of their savings.
The individual investors would like to know the investment avenues so that they can use their discretion and invest in those avenues, which will give them security and stable return. The ultimate aim of individual investors is to find a variety of investment avenues that meet their preference for risk and expected return. The investment avenues like financial and physical assets have a wide range of risks from risk-free to highly speculative avenues. From this broad-spectrum, individual investors will have to select these avenues that maximize their utility. The investment decisions are influenced by some factors such as preferences, size of the amount involved, the safety of funds, regular and steady returns, easy accessibility and manageability of assets, etc. Hence, individual investors are to choose financial and physical assets that fulfil their future expectations.
1.2 Objective Of The Study:
Primary objective:
- To study the investor perception of investing in physical assets vs financial assets
Secondary objective:
- To study different investment avenues chosen by a various segments of people.
- To study the investor’s awareness in investing in physical assets vs financial assets
1.3 Need Of The Study:
Investing ensures present and future long-term financial security. The money generated from your investments can provide financial security and income. One of the ways investments like stocks, bonds, and ETFs provide income is by way of a dividend. This is an amount paid to shareholders simply for holding the investment. Because many investments pay monthly, quarterly, or annual distributions, you can enjoy passive income that ultimately could replace your paysheet.
1.4 Scope Of The Study:
This study helps to know about the relationship between the investment in physical assets vs financial assets. It is very much essential because investing forms the basis for the development of the economy. If the investment pattern among the physical assets vs financial assets, then it leads to the development of both money and capital market which results in the development of the economy. The present study is undertaken to identify the extent, nature and preferences, perception of the investors employed in the physical assets vs financial assets to ascertain their investment habits. This study will help both the private and government sector investors to plan physical assets vs financial assets investment towards maximizing the returns and various other factors.
1.5 Limitations Of The Study:
The present study traces the trends in investments made by individual investors in financial and physical assets. Since the economic liberalization was initiated in 1990-91; there has been a noticeable shift in the investment pattern on account of changes in lifestyle, the introduction of different investment schemes, the safety of investment, etc. Individual investors prefer to invest in those assets they consider suitable ones or fulfil their needs either in the short-term or in the long term. However, the size of income and savings influence the quantum of investment. The study covers the individual investors engaged in various occupations namely agriculture, business, service, profession and other activities of the Coimbatore district.
2. Literature Review
2.1 Review of literature
Various studies on Investment patterns & Investment behaviour of investors had been conducted in foreign countries. Depending on the various issues of investment, the review has been discussed in brief as follows:
Abdulla Yameen (2020) delivered the message, investors will need to be alert to any new development in the capital market and take advantage of the Investor Education and Awareness Campaign program which is to be undertaken by the Capital Market Section to acquaint of the risks and rewards of investing on the Capital market Speech was also focused on to create a new breed of financial intermediaries, which will deal on the market for their clients. These intermediaries have to be professionals with quite advanced knowledge on stock exchange operations, techniques, law and companies’ valuation. Investors depend to a large extent on their professional advice when investing in the market. Furthermore, these intermediaries must be men of integrity and honesty as they would deal with clients‟ money Confidence of investors in these professionals is a key to the success of the capital market.
Makbul Rahim (2019) argued in his speech that the regulatory framework must provide the right environment for the development and growth of the market. High standards of probity and professional conduct have to be maintained and reach world-class standards. Integrity is very important as well as confidence. The development of a proper free flow of information and disclosure helps investors to make informed investment decisions.
P. M. Deleep Kumar and G. Raju (2019) showed that the capital market is becoming more and more risky and complex in nature so that ordinary investors are unable to keep track of its movement and direction. The study revealed that the Indian market is probably more volatile than developed country markets, which is probably why a much higher proportion of savings in developed countries go into equities. More than half of individual shareowners in India belonged to just five cities. The distribution of share ownership by States and Union Territories shows that just five States accounted for 74.7 per cent of the country’s share ownership population and 71.7 per cent.
Peter Carr and Dilip Madan (2019) disclosed that generally does not formally consider derivatives securities as a potential investment vehicle. Derivatives are considered at all, they are only viewed as tactical vehicles for efficiently re-allocating funds across broad asset classes, such as cash, fixed income, equity and alternative investments. They studied that under reasonable market conditions, derivatives comprise an important, interesting and separate asset class, imperfectly correlated with other broad asset classes. If derivatives are not held in our economy, then the investor confines his holdings to the bond and the stock and the optimal derivatives position is zero.
Prof. Peter McKenzie (2018) in his speech at seminar investors have a choice instead of placing their money in only one company they can pick areas of growth and move their money, buying and selling and placing it where it is going to be most profitable. The individual investor does not have to make an individual decision where to place his savings. These decisions are made by an expert fund manager, which would spread the risk by spreading the investments across different sectors of the economy.
Hong Kong Exchanges and Clearing Ltd. (2018) surveyed derivatives retail investors and argued first based on empirical evidence that years of trading experience and usual deal size have a positive correlation. Second, Male investors traded to trade more frequently than female investors. Third, the usual deal size of investors with higher personal income traded to be larger. The fourth majority of respondents are motivated by their stock trading experience to start derivatives trading. Fifth, trading for profit is the key reason for derivatives trading other than the high rate of return, hedging, etc. Sixth, the most significant motivating factors are a more liquid market and a more transparent market. Seventh, the majority of traders are infrequent in trade- 3 times or less in a month and Index futures is the most popular product to trade most frequently. Ninth, a large proportion of the investors invest in exchange cash products than derivatives or investment avenues. Through empirical evidence from investor’s opinions, the study argued that the liquidity of derivatives products other than futures is low.
S. M. Imamual Haque and Khan Ashfaq Ahmad (2018) argued that the sluggish trends in primary equity markets need to be reversed by restoring investors‟ confidence in the market. Savings for retirement essential seek long term growth and for that equity investment is desirable. It is a well-established fact that investments in equities give higher returns than debt and it would, therefore, be in the interest of the banks to invest in inequities.
Warren Buffet (2017) argued that derivatives as time bombs, both for the parties that deal in them and the economic system. He also argued that those who trade derivatives are usually paid, in whole or part, on “earnings” calculated by mark-to-market accounting. But often there is no real market, and “mark-to-model” is utilized. This substitution can bring on large-scale mischief. In extreme cases, mark-to-model degenerates into mark-to-myth. Many people argue that derivatives reduce systemic problems, in that participants who can’t bear certain risks can transfer them to stronger hands.
Swarup K. S. (2017) empirically found that equity investors first enter the capital market through investment in the primary market. The main reason for the slump in equity offering is a lack of investor confidence in the primary market. It appeared from the analysis that the investors give importance to their own analysis as compared to brokers‟ advice. They also consider market price as a better indicator than analyst recommendations. Accordingly, several suggestive measures in terms of regulatory, policy level and market-oriented were suggested to improve the investor confidence in equity primary markets.
Leyla Şenturk Ozer, Azize Ergeneli and Mehmet Baha Karan (2017) studied that the risk factor is one of the main determinants of investment decisions. Market participants that are rational investors ultimately should receive greater returns from more risky investments. They also concluded that the crisis and the resulting deep recession in 2002 changed many things, including the market confidence of investors and financial analysts. In addition to decreasing the trading volume of the Istanbul Stock Exchange (ISE), the number of individual investors reduced and the investment horizon of investors shortened and liquid instruments.
JenniferReynolds-Moehrle (2016) used a sample of derivative user and non-user firms; they came to know that analysts‟ forecast accuracy increased and that unexpected earnings are incorporated into subsequent earnings forecasts to a greater extent after disclosure of sustained hedging activity. Additionally, the findings indicated an increase in the earnings-return relation in the hedging activity period.
Rajeswari, T. R. and Moorthy, V. E. R. (2016) said that expectations of the investors influenced by their perception and human generally relate perception to action. The study revealed that the most preferred vehicle is bank deposit with mutual funds and equity on fourth and sixth respectively.
Chris Veld and Yulia V. Veld-Merkoulova (2015) found that investors consider the original investment returns to be the most important benchmark, followed by the risk-free rate of return and the market return. The study found that investors with longer time horizons would generally be better off investing in stocks compared to investors with shorter time horizons. They knew through the question on risk perceptions that investors who are more risk-tolerant would benefit from relatively larger investments in stocks. Their study showed the investors optimize their utility by choosing the alternative with the lowest perceived risk.
G.N. Bajpai (2015) showed that continuously monitors performance through movements of share prices in the market and the threats of takeover improve the efficiency of resource utilization and thereby significantly increases returns on investment. As a result, savers and investors are not constrained by their individual abilities but fascinated by the economy’s capability to invest and save, which inevitably enhances savings and investment in the economy. Thus, the capital market converts a given stock of investible resources into a larger flow of goods and services and augments economic growth. The study concluded the investors and issuers can take comfort and undertake transactions with confidence if the intermediaries as well as their employees (i.) follow a code of conduct and deal with probity and (ii) are capable of providing professional services.
J. K. Nayak (2015) interpreted the preferred mode of investment as first equity, banks, mutual fund, and then any other in descending order. It means investors’ faith has increased and their risk-taking ability has also increased. One thing that could be drawn from this study is that problems are mostly broker-related and therefore that is one area where reforms are required. The investors feel that the amount of knowledge available on the equity market is not satisfactory.
Narender L. Ahuja (2014) expressed Futures and options trading helps in hedging the price risk and also provides investment opportunities to speculators who are willing to assume the risk for a possible return. They can also help in building a competitive edge and enable businesses to smoothen their earnings because non-hedging of the risk would increase the volatility of their quarterly earnings. At the same time, too much speculative activity in essential commodities would indeed destabilize the markets and therefore, these markets are normally regulated as per the laws of the country. Randall Dodd and Stephany Griffith-Jones (2013) studied that derivatives markets serve two important economic purposes: risk shifting and price discovery. Derivatives markets can serve to determine not just spot prices but also future prices (and in the options the price of the risk is determined). In the research, interviews with representatives from several major corporations revealed that they sometimes prefer to use options as a means to hedge. They also argued derivatives have the potential to encourage international capital inflows.
K. Ravichandran (2013) argued the younger generation investors are willing to invest in capital market instruments and that too very highly in the Derivatives segment. Even though the knowledge to the investors in the Derivative segment is not adequate, they tend to make decisions with the help of the brokers or through their friends and were trying to invest in this market. He also argued the majority of the investors want to invest in short-term funds instead of long-term funds that prefer wealth maximization instruments followed by steady growth instruments. Empirical study also shows that market risk and credit risk are the two major risks perceived by the investors, and for minimizing that risk they take the help of newspaper and financial experts. Derivatives act as a major tool for reducing the risk involved in investing in stock markets for getting the best results out of it. Investors should be aware of the various hedging and speculation strategies, which can be used for reducing their risk. Awareness about the various uses of derivatives can help investors to reduce risk and increase profits. Though the stock market is subjected to high risk, by using derivatives the loss can be minimized to an extent.
Nicole Branger and Beate Breuer (2012) showed that investors can benefit from including derivatives into their portfolios. For retail investors, however, direct investment in derivatives is often too complicated. They argued if the investor can trade only in the stock and money market account, the exposure of his portfolio to volatility risk will be zero, and the relation between the exposure to stock diffusion risk and jump risk will be fixed. They proved through documentation both theoretically and empirically that investors can increase their utility significantly by trading plain vanilla options. And also told that in a complete market and with continuous trading, it does not matter which derivatives an investor uses to realize his optimal asset allocation. But with incomplete markets, and in particular, discrete trading, on the other hand, the choice of derivatives may actually matter a lot.
Philipp Schmitz and Martin Weber (2011) exposed that the trading behavior is also influenced if the underlying reaches some exceptional prices. The probability to buy calls is positively related to the holding of the underlying in the portfolio, meaning that investors tend to leverage their stock positions, while the relation between put purchases and portfolio holdings of the underlying is negative. They also showed higher options market trading activity is positively correlated with past returns and volatility, and negatively correlated with book-to-market ratios. In addition, they report that investors open and close long and short call positions if the past week’s return is positive and write puts as well as close bought and written put positions if the past returns are negative
. B. Das, Ms S. Mohanty, and N. Chandra Shil (2011) studied the behavior of the investors in the selection of investment vehicles. Retail investors face a lot of problems in the stock market. Empirically they found and concluded which are valuable for both the investors and the companies having such investment opportunities. First, different investment avenues do not provide the same level of satisfaction. And the majority of investors are from the younger group.
Gupta and Naveen Jain (2011) found that the majority of the investors are from the younger group and as per occupation, salaried persons are more inclined towards investment. The study also argued education qualification is the major influenced factor in investment. Their most preferred investment is found to be shares followed by mutual funds. Empirically they found and argued the Indian stock market is considerably dominated by the speculating crowd, the large scale of day trading, and also the fact the futures trading in individual stocks is several times the value of trading in the cash segment. They also found the largest proportion of the investors are worried about too much volatility of the market. For traders and speculators, price volatility is an opportunity to make quick profits. In the study, high proportions of investors have a very favorable opinion about capital market regulation.
Prasanna P. K. (2011) empirically found that foreign investors invested more in companies with a higher volume of shares owned by the general public. Foreign investors choose the companies where family shareholding of promoters is not essential. The study concluded that corporate performance is the major influencing factor for investment decisions for any investor.
keep Kumar PM and Deyanandan M N (2011) analyzed the opinion of retail investors on the major market reforms as well as their investment performance. The study revealed the introduction of derivatives trading and internet trading are found useful by only a marginal group of investors. The empirical results of the study concluded that even though SEBI claims itself to be the champion of investor protection, it has not been successful in instilling a sense of confidence in the minds of the majority of investors.
G. Ramakrishna Reddy and Ch. Krishnudu (2011) summarized that a majority of the investors are quite unaware of corporate investment avenues like equity, mutual funds, debt securities, and deposits. They are highly aware of traditional investment avenues like real estate, bullion, bank deposits, life insurance schemes, and small saving schemes Study argued the primary motive of investment among small and individual investors is to earn a regular income either in form of interest or dividend on the investment made.
K. Logeshwari and V. Ramadevi (2010) advocated that a commodities market provides a platform for the investors as well as hedgers to protect their economic interests as well as increase their investible wealth. Commodity prices are generally less volatile than stocks.
Nidhi Walia and Ravi Kiran (2010) studied that to satisfy the needs of investors‟ mutual funds are designing more lucrative and innovative tools considering the appetite for risk-taking of individual investors. A successful investor strives to achieve not less than a rate of return consistent with the risk assumed. They also argued as per observation by survey responses of the individual investor’s fact is clear that overall among other investment avenues capital market instruments are at the priority of investors but the level of preference varies with different categories/levels of income, and an association exists between income status of investors and their preference for the capital market instrument with return as objective.
Vinay Mishra and Harshita Bhatnagar (2010) documented that Derivatives are considered to be extremely versatile financial instruments, as they help to manage risks, lower funding costs, enhance yields, and diversify portfolios. The contributions made by derivatives have been so great that they have been credited with having „changed the face of finance‟ in the world. Derivatives markets are an integral part of capital markets in developed as well as emerging market economies.
These instruments assist business growth by disseminating effective price signals concerning exchange rates, indices, and reference rates, or other assets, thereby, rendering both cash and derivatives markets more efficient.
Ashutosh Vashishtha and Satish Kumar (2009) studied encompasses scope an analysis of historical roots of the derivative market of India. The emergence of the derivatives market is an ingenious feat of financial engineering that provides an effective and less costly solution to the problem of risk that is embedded in the price unpredictability of the underlying asset. In India, since its inception derivatives market has exhibited exponential growth both in terms of volume and number of traded contracts. They argued that NSE and BSE have added more products in their derivatives segment but still it is far less than the depth and variety of products prevailing across many developed capital markets.
David Nicolaus (2009) studied that retail derivatives allow retail investors to pursue sophisticated trading, investment strategies, and hedging financial instruments. Retail investors‟ motivation for improving the after-tax return of their household portfolio represents a major driver of the derivatives choice of the products and that provide only little equity exposure for the investor. The derivatives reveal the divergent belief of retail investors about the future price level of the underlying as these can be tailored to the specific demand of the investor. He argued the potential role of search costs and financial advice on the portfolio decisions of retail investors, the flexibility of retail derivatives, and low issuance costs are likely to emphasize the existing frictions.
Gaurav Kabra, Prashant Mishra, and Manoj Dash (2009) studied key factors influencing investment behaviors and ways these factors impact investment risk tolerance and decision-making process among men and women and those different age groups. They said that not all investments will be profitable, as investors will not always make the correct investment decisions over the period of years. Through evidence they proved that security is the most important criterion; there is no significant difference of security, opinion, hedging in all age groups. But there is a significant difference in awareness, benefits, and duration in all age groups. From the empirical results,, they concluded the modern investor is a mature and adequately groomed person.
3. Research Methodology
3.1 Research Design
The research design specifies the methods and procedures for conducting a particular study. The objectives of the study have restricted the choice of research design up to descriptive research design. Therefore, no fixed hypothesis is set up. This survey will help the firm to know how the investors invest in equity and mutual funds.
3.2 Sources of data
3.2.1 Primary Source of Data:
- The primary source of data is being collected by preparing a Questionnaire
- Online questionnaire was given to friends and family and data was collected
3.2.2 Secondary Source of Data:
For having a detailed study about this topic, it is necessary to have some of the secondary information, which is collected from the following: –
- Books.
- Magazines & Journals.
- Websites, Newspapers, etc.
3.3 Sample Design:
3.3.1 Sampling Size:
The numbers of respondents selected for conducting the survey are 100 investors. These samples are collected on a random basis. The investor’s responses are analyzed to know their investment in equity and mutual funds which factors play an important role in their investment decisions & how far the investors like to invest in equity and mutual funds.
3.3.2 Period of study:
The period of study was undertaken from January 2021 to March 2021.
3.3.3 Sampling Method:
Convenience sampling is a specific type of non-probability sampling method that relies on data collection from population members who are conveniently available to participate in the study. Convenience sampling is a type of sampling where the first available primary data source will be used for the research without additional requirements.
3.4 Presentation of Data
The presentation of data is through “CHARTS AND GRAPHS” which will help in analyzing the response of the investors. In this study sample,, 22 questions were framed for analyzing a comparative between equity investment and mutual funds. Various tools like the Chi-square test and percentage analysis are used for analyzing the data
3.5 Tools for analysis
The collected data were analysed using tools like
- Simple percentage analysis
- Chi square test
- Correlation
Simple Percentage Method
The various factors of are analysed based on the percentage of statistical among the sample size 100 from these samples the percentage of satisfied level are found to give a conclusion
Simple percentage = (No. of the respondents/Total number of respondents)x 100
Chi-Square Test
Chi-square rests symbolically written as i.e., is a statistical measure with the help of which, it is possible to assess the significance of the difference between the observed frequencies and the expected frequencies obtained from some hypothetical universe chi-square test, whether more than two population portions can be considered equal.
x2 = ∑(Oij – Eij )2 / Eij
Oil = Observed frequency of the cell in the ith row and jth column
Eij = Expected frequency of the cell in the ith row and jth column
The degrees of freedom if ‘n’ is the number of groups and one constraint is placed by making the totals of observed and expected frequencies equal, the d.f would be equal to (n-1). In the case of a contingency table (i.e., a table with 2 columns and more than 2 rows and more than 2 columns), the d.f is worked as follows:
d.f = (c-1)(r-1)
Where ‘ca means the number of columns and ‘a means the number of rows.
Correlation Analysis
Correlation Analysis is a statistical technique used to measure the magnitude of the linear relationship between two variables. Correlation Analysis is not used in isolation to describe the relationship between variables. To analyze the relation between two variables, two prominent correlation coefficients are used –the Pearson product correlation coefficient and Spearman’s rank correlation coefficient.
In this study, the Pearson product correlation coefficient is used to find the correlation coefficient between respondent’s awareness level at the time of joining with employee’s participation in suggestion scheme & respondents awareness level at present and the counselling. This is also known as simple correlation coefficient and is denoted by “employee’s “r” value ranges from -1, through 0, to +1 It is calculated using the formula
r = ∑ XY / √∑ x2.∑ y2
4. Analysis And Discussion
Table No 4.1
Age
| S.No | Age | No. of Respondents | Percentage % |
| 1 | Less than 20 years | 11 | 11 |
| 2 | 20 – 40 years | 16 | 16 |
| 3 | 40-60 years | 29 | 29 |
| 4 | Above 60 years | 44 | 44 |
| Total | 100 | 100 |
Interpretation
From the above table, we found that 11% of the respondents were at the age group of Fewer than 20 years, 16% of the respondents were at the age group of 20 – 40 years, 29% of the respondents were at the age group of 40-60 years and 44% of the respondents were at the age group of Above 60 years.
CHART NO 4.1
AGE
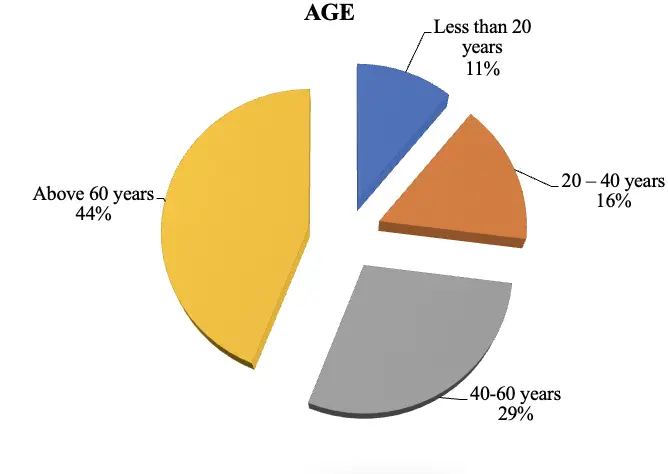
TABLE NO 4.2
GENDER
| S.No | Gender | No. of Respondents | Percentage % |
| 1 | Male | 89 | 89 |
| 2 | Female | 11 | 11 |
| Total | 100 | 100 |
Source: Primary Data
INTERPRETATION
From the above table, we found that 89% of the respondents were male and 11% of the respondents were Female.
CHART NO 4.2
GENDER
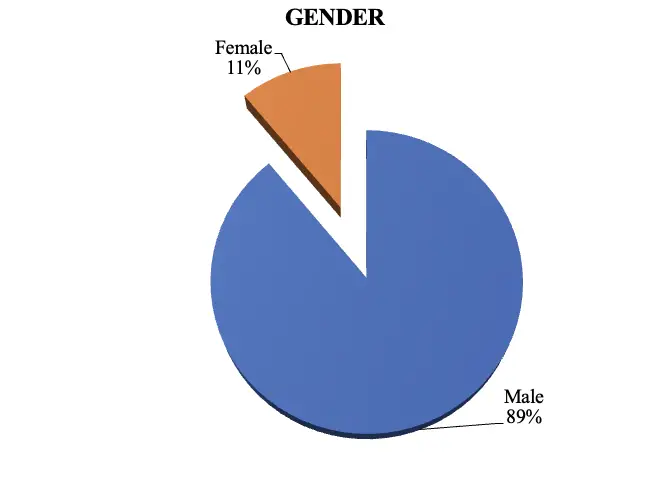
TABLE NO 4.3
MARITAL STATUS
| S.No | Marital Status | No. of Respondents | Percentage % |
| 1 | Married | 66 | 66 |
| 2 | Unmarried | 34 | 34 |
| Total | 100 | 100 |
Source: Primary Data
INTERPRETATION
From the above table, we found that 66% of the respondents were married and 34% of the respondents were Unmarried.
CHART NO 4.3
MARITAL STATUS
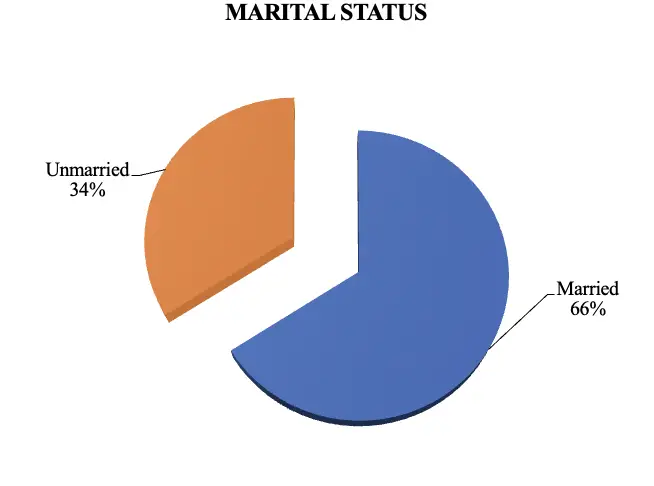
TABLE NO 4.4
EDUCATIONAL BACKGROUND
| S.No | Educational Background | No. of Respondents | Percentage % |
| 1 | School level Education | 17 | 17 |
| 2 | Under Graduate | 44 | 44 |
| 3 | Post Graduate | 19 | 19 |
| 4 | Others | 20 | 20 |
| Total | 100 | 100 |
Source: Primary Data
INTERPRETATION
From the above table, we found that 17% of the respondent’s education level is School level Education, 44% of the respondent’s education level is Under Graduate, 19% of the respondent’s education level is Post Graduate and 20% of the respondent’s education level is Others.
CHART NO 4.4
EDUCATIONAL BACKGROUND
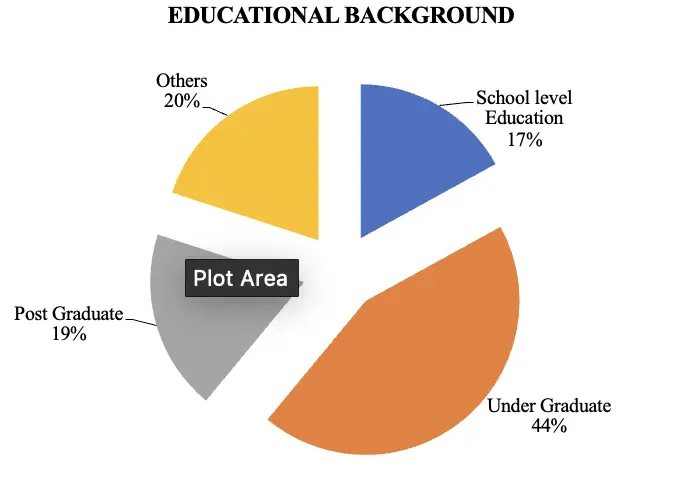
TABLE NO 4.5
OCCUPATION/PROFESSION
| S.No | Occupation/Profession | No. of Respondents | Percentage % |
| 1 | Salaried | 19 | 19 |
| 2 | Professional | 27 | 27 |
| 3 | Business | 7 | 7 |
| 4 | Government Employee | 41 | 41 |
| 5 | Retired | 6 | 6 |
| 6 | Others | 0 | 0 |
| Total | 100 | 100 |
Source: Primary Data
INTERPRETATION
From the above table, we found that 19% of the respondents were Salaried, 27% of the respondents were Professional, 7% of the respondents were Business people, 41% of the respondents were Government employees and 6% of the respondents were retired persons.
CHART NO 4.5
OCCUPATION/PROFESSION
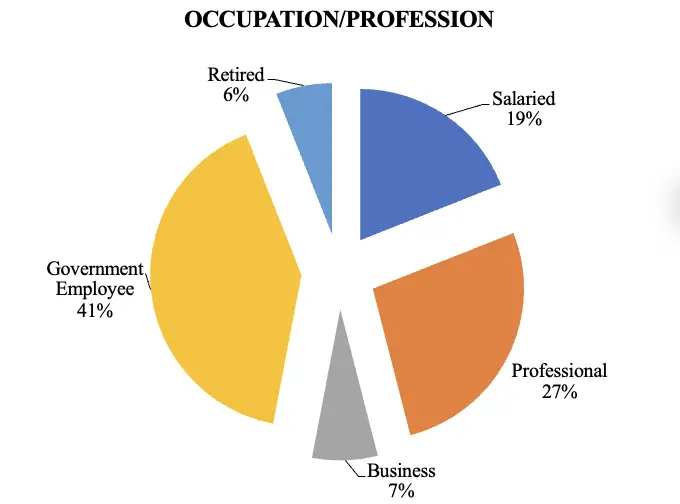
TABLE NO 4.6
FAMILY SIZE
| S.No | Family size | No. of Respondents | Percentage % |
| 1 | Less than 4 | 22 | 22 |
| 2 | 4 to 6 | 55 | 55 |
| 3 | Above 6 | 23 | 23 |
| Total | 100 | 100 |
Source: Primary Data
INTERPRETATION
From the above table we found that 22% of the respondents Family size Less than 4, 55% of the respondents Family size 4 to 6 and 23% of the respondents Family size Above 6.
CHART NO 4.6
FAMILY SIZE
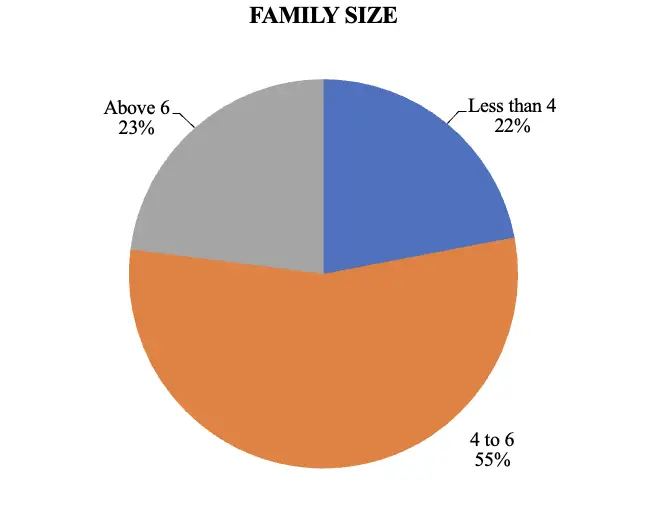
TABLE NO 4.7
NO. OF EARNING MEMBERS
| S.No | No. Of Earning Members | No. of Respondents | Percentage % |
| 1 | 1 | 22 | 22 |
| 2 | 2 | 42 | 42 |
| 3 | 3 & above | 36 | 36 |
| Total | 100 | 100 |
Source: Primary Data
INTERPRETATION
From the above table, we found that 22% of the respondents say the number of earning members in their family is 1, 42% of the respondent’s number of earning members in their family is 2 and 36% of the respondent’s number of earning member in their family is 3 & above.
CHART NO 4.7
NO. OF EARNING MEMBERS
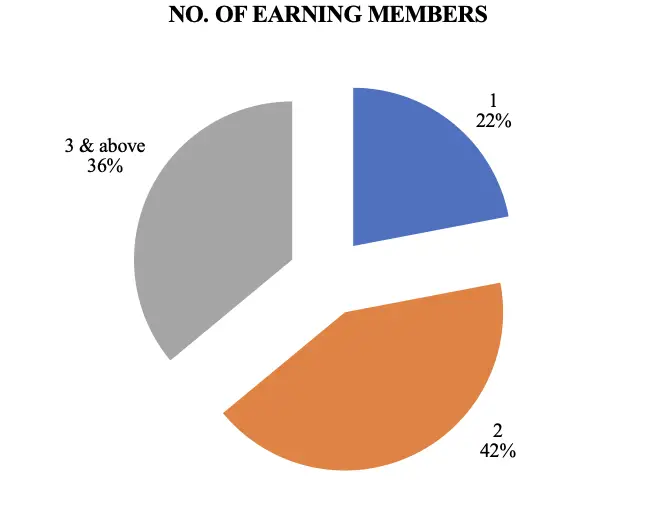
TABLE NO 4.8
MONTHLY INCOME
| S. No | Monthly Income | No. of Respondents | Percentage % |
| 1 | Below Rs. 20,000 | 21 | 21 |
| 2 | Rs. 20,000 – Rs. 40,000 | 27 | 27 |
| 3 | Rs. 40,000 – Rs. 60,000 | 11 | 11 |
| 4 | Rs. 60,000 & above | 41 | 41 |
| Total | 100 | 100 |
Source: Primary Data
INTERPRETATION
From the above table, we found that 21% of the respondent’s monthly income range is Below Rs. 20,000, 27% of the respondent’s monthly income range is Rs. 20,000 – Rs. 40,000, 11% of the respondent’s monthly income range is Rs. 40,000 – Rs. 60,000 and 41% of the respondent’s monthly income range are Rs. 60,000 & above.
CHART NO 4.8
MONTHLY INCOME
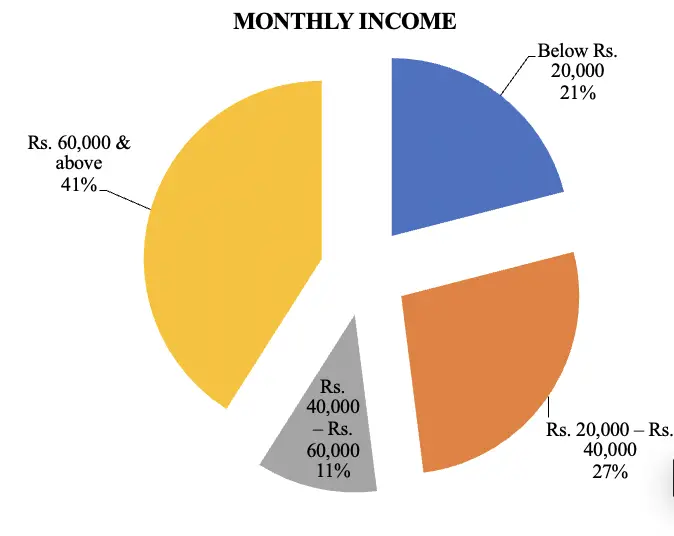
TABLE NO 4.9
SOURCE OF AWARENESS ABOUT MUTUAL FUND
| S. No | Source of awareness about mutual fund | No. of Respondents | Percentage % |
| 1 | Business television Channels | 31 | 31 |
| 2 | Business newspapers | 49 | 49 |
| 3 | Investment-related websites. | 16 | 16 |
| 4 | Social Networks | 1 | 1 |
| 5 | Others | 3 | 3 |
| Total | 100 | 100 |
Source: Primary Data
INTERPRETATION
From the above table, we found that 31% of the respondents were aware of the mutual funds through Business television Channels, 49% of the respondents were aware of mutual funds through Business newspapers, 16% of the respondents were aware of the mutual funds through Investment-related websites, 1% of the respondents aware about mutual fund through Social Networks and 3% of the respondents aware about mutual fund through Others.
CHART NO 4.9
SOURCE OF AWARENESS ABOUT MUTUAL FUND
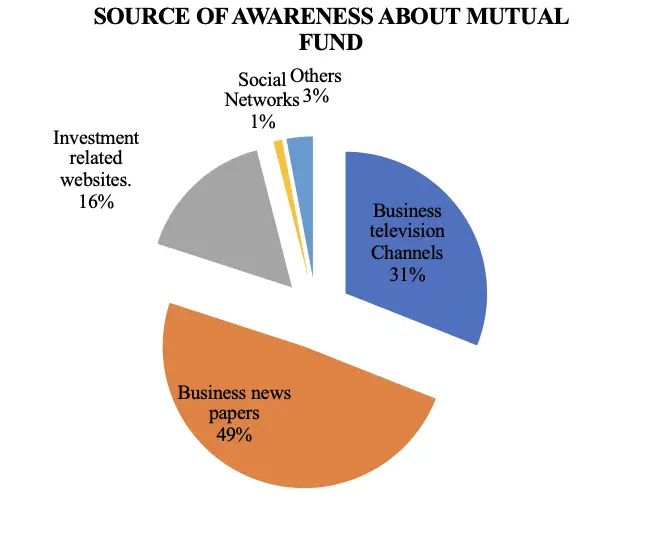
TABLE NO 4.10
TYPE OF INVESTOR
| S.No | Type of investor | No. of Respondents | Percentage % |
| 1 | Hereditary investor | 83 | 83 |
| 2 | New generation investor | 17 | 17 |
| Total | 100 | 100 |
Source: Primary Data
INTERPRETATION
From the above table, we found that 83% of the respondents were Hereditary investors and 17% of the respondents were New generation investors.
CHART NO 4.10
TYPE OF INVESTOR
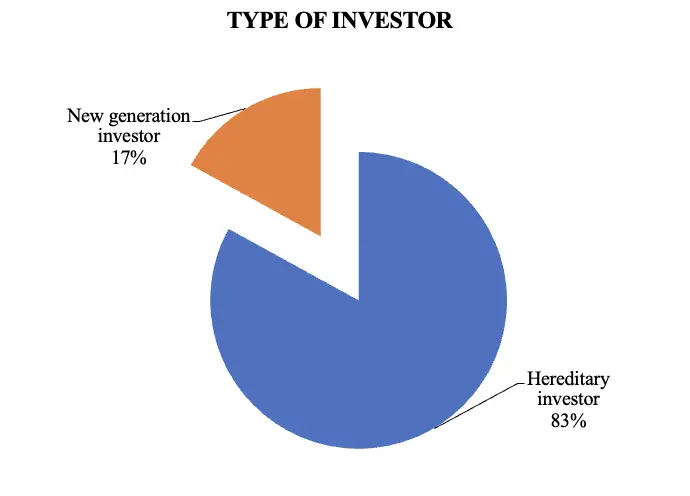
TABLE NO 4.11
CATEGORY PREFER TO INVEST
| S. No | Category prefer to invest | No. of Respondents | Percentage % |
| 1 | Long term investor | 70 | 70 |
| 2 | Day trader | 9 | 9 |
| 3 | Both | 21 | 21 |
| Total | 100 | 100 |
Source: Primary Data
INTERPRETATION
From the above table, we found that 70% of the respondents prefer Long term investors, 9% of the respondents prefer Day traders and 21% of the respondents prefer Both.
CHART NO 4.11
CATEGORY PREFER TO INVEST
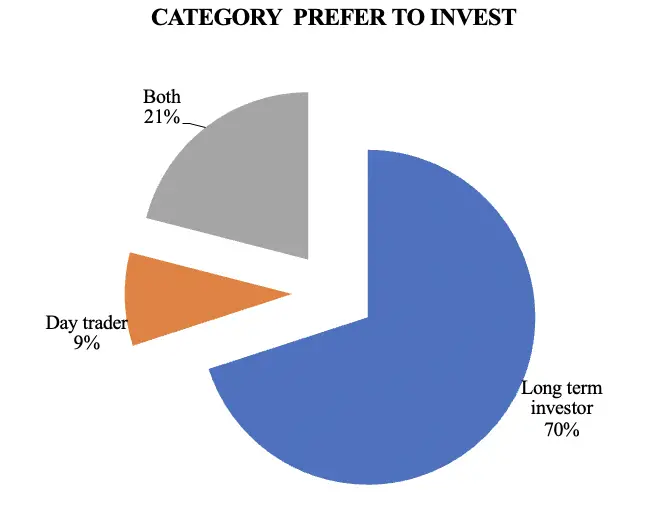
TABLE NO 4.12
NUMBER OF COMPANIES INVESTED
| S. No | Number of companies invested | No. of Respondents | Percentage % |
| 1 | Less than 10 | 69 | 69 |
| 2 | 10 to 20 | 26 | 26 |
| 3 | 20 & above | 5 | 5 |
| Total | 100 | 100 |
Source: Primary Data
INTERPRETATION
From the above table, we found that 69% of the respondents invested in Less than 10, 26% of the respondents invested in 10 to 20 and 5% of the respondents invested in 20 & above.
CHART NO 4.12
NUMBER OF COMPANIES INVESTED

TABLE NO 4.13
SIZE OF INVESTMENT IN SHARES
| S. No | Size of investment in shares | No. of Respondents | Percentage % |
| 1 | Below Rs. 1 Lakh | 21 | 21 |
| 2 | Rs. 1 lakh – Rs. 2 lakhs | 66 | 66 |
| 3 | Rs. 2 lakhs & above | 13 | 13 |
| Total | 100 | 100 |
Source: Primary Data
INTERPRETATION
From the above table we found that 21% of the respondents were invested Below Rs. 1 Lakh, 66% of the respondents were invested Rs. 1 lakh – Rs. 2 lakhs and 13% of the respondents were invested Rs. 2 lakhs & above.
CHART NO 4.13
SIZE OF INVESTMENT IN SHARES
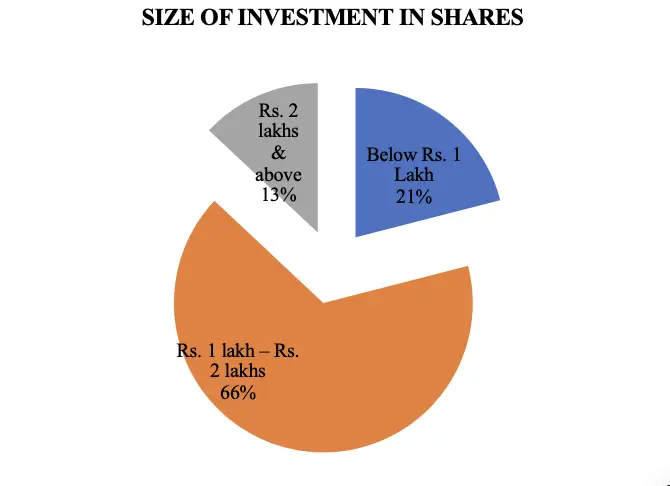
TABLE NO 4.14
PERCENTAGE OF SAVINGS IN SHARES
| S. No | Percentage of savings in shares | No. of Respondents | Percentage % |
| 1 | Less than 15 % | 26 | 26 |
| 2 | 15%-30% | 21 | 21 |
| 3 | 30% and above | 53 | 53 |
| Total | 100 | 100 |
Source: Primary Data
INTERPRETATION
From the above table, we found that 26% of the respondents save their savings in share Less than 15 %, 21% of the respondents saves their savings in share 15%-30% and 53% of the respondents saves their savings in share 30% and above.
CHART NO 4.14
PERCENTAGE OF SAVINGS IN SHARES
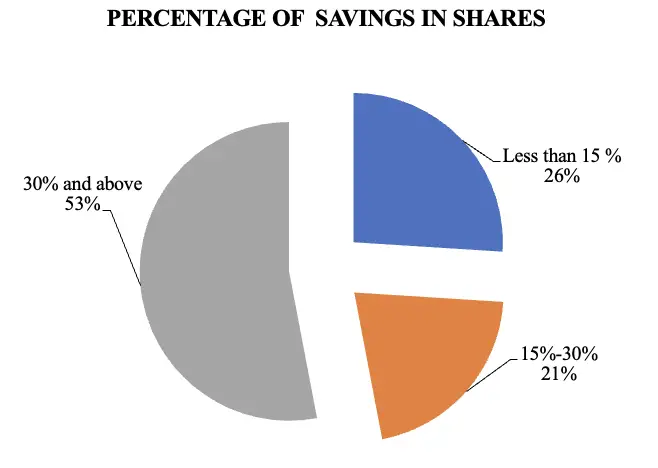
TABLE NO 4.15
PREFERED INVESTMENT CRITERIA
| S. No | Preferred investment criteria | No. of Respondents | Percentage % |
| 1 | Mutual fund | 32 | 32 |
| 2 | Stocks | 29 | 29 |
| 3 | Derivative market | 17 | 17 |
| 4 | Commodity future trading | 22 | 22 |
| Total | 100 | 100 |
Source: Primary Data
INTERPRETATION
From the above table, we found that 32% of the respondents prefer to invest in Mutual funds, 29% of the respondents prefer to invest in Stocks, 17% of the respondents prefer to invest in Derivative market and 22% of the respondents prefer to invest in commodity futures trading.
CHART NO 4.15
PREFERRED INVESTMENT CRITERIA
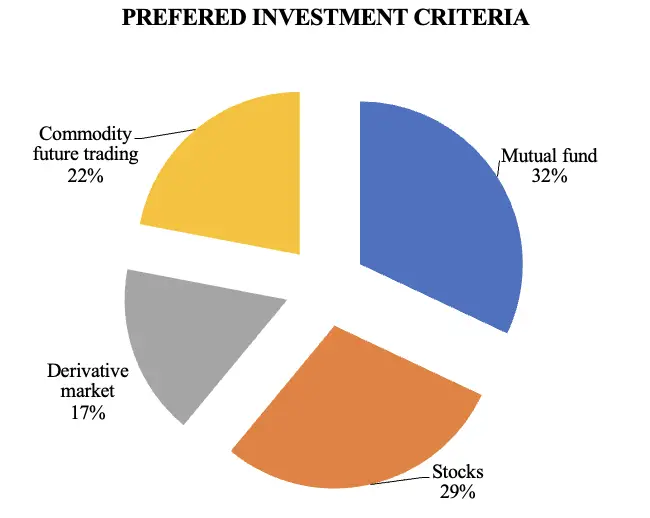
TABLE NO 4.16
DURATION OF INVESTMENT
| S. No | Duration of investment | No. of Respondents | Percentage % |
| 1 | Upto2years | 77 | 77 |
| 2 | 2-4Years | 13 | 13 |
| 3 | 4-6Years | 2 | 2 |
| 4 | Above 6Years | 8 | 8 |
| Total | 100 | 100 |
Source: Primary Data
INTERPRETATION
From the above table, we found that 77% of the respondents were investing Upto2years, 13% of the respondents were investing for 2-4Years, 2% of the respondents were investing for 4-6Years and 8% of the respondents were investing Above 6 Years.
CHART NO 4.16
DURATION OF INVESTMENT
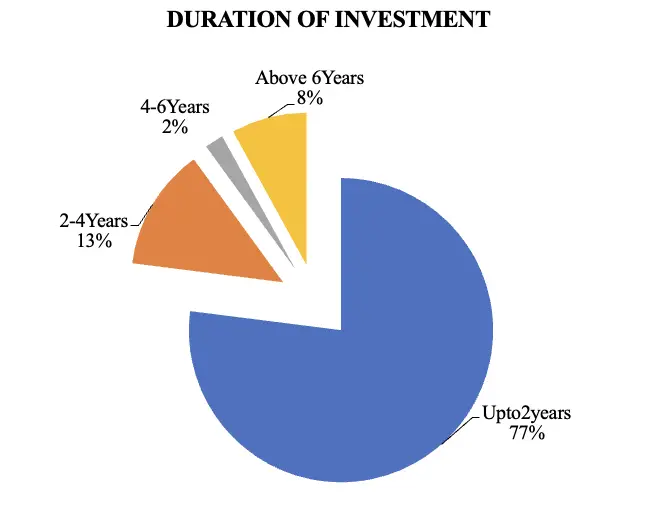
TABLE NO 4.17
FREQUENCY OF INVESTMENT
| S. No | Frequency of investment | No. of Respondents | Percentage % |
| 1 | Daily | 21 | 21 |
| 2 | Weekly | 66 | 66 |
| 3 | Monthly | 5 | 5 |
| 4 | Yearly | 8 | 8 |
| Total | 100 | 100 |
Source: Primary Data
INTERPRETATION
From the above table, we found that 21% of the respondents invest Daily, 66% of the respondents invest Weekly, 5% of the respondents invest Monthly and 8% of the respondents invest Yearly.
CHART NO 4.17
FREQUENCY OF INVESTMENT
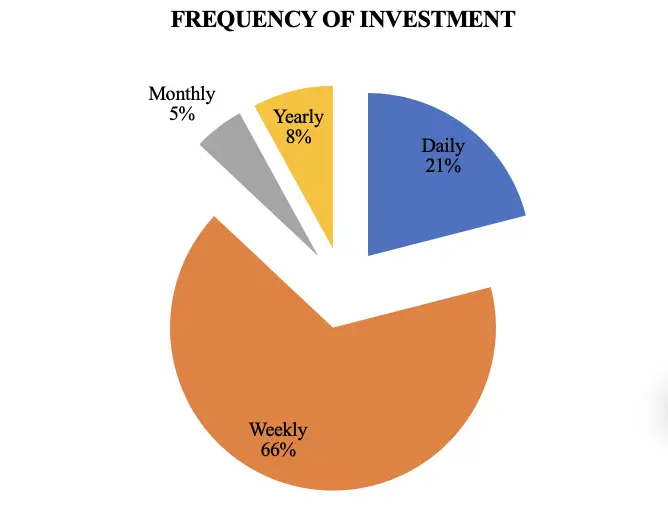
TABLE NO 4.18
PREFERED MODE OF TRADING
| S. No | Preferred Mode of trading | No. of Respondents | Percentage % |
| 1 | Online | 27 | 27 |
| 2 | Offline | 69 | 69 |
| 3 | Both | 4 | 4 |
| Total | 100 | 100 |
Source: Primary Data
INTERPRETATION
From the above table, we found that 27% of the respondents prefer to trade Online, 69% of the respondents prefer to trade Offline and 4% of the respondents prefer to trade Both.
CHART NO 4.18
PREFERRED MODE OF TRADING
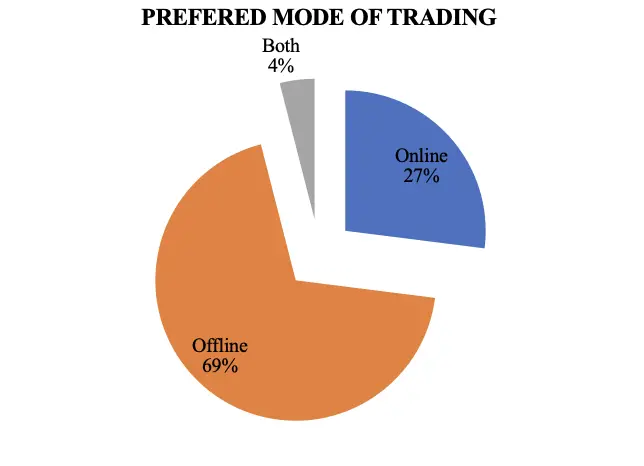
TABLE NO 4.19
REASON TO CHOOSE ONLINE TRADING
| S. No | Reason to choose online trading | No. of Respondents | Percentage % |
| 1 | Immediate placement of orders | 9 | 9 |
| 2 | Immediate modification of orders | 17 | 17 |
| 3 | Easy to put many buying and selling orders | 2 | 2 |
| 4 | Reduction in cost of placing orders | 14 | 14 |
| 5 | Easy to transfer funds | 44 | 44 |
| 6 | Online notification of investment tips | 14 | 14 |
| Total | 100 | 100 |
Source: Primary Data
INTERPRETATION
From the above table we found that 9% of the respondents choose online trading because it is Immediate placement of orders, 17% of the respondents choose online trading because it is Immediate modification of orders, 2% of the respondents choose online trading because it is easy to put many buying and selling orders, 14% of the respondents choose online trading because it is Reduction in cost of placing orders, 44% of the respondents choose online trading because it is easy to transfer funds and 14% of the respondents choose online trading because it is Online notification of investment tips.
CHART NO 4.19
REASON TO CHOOSE ONLINE TRADING
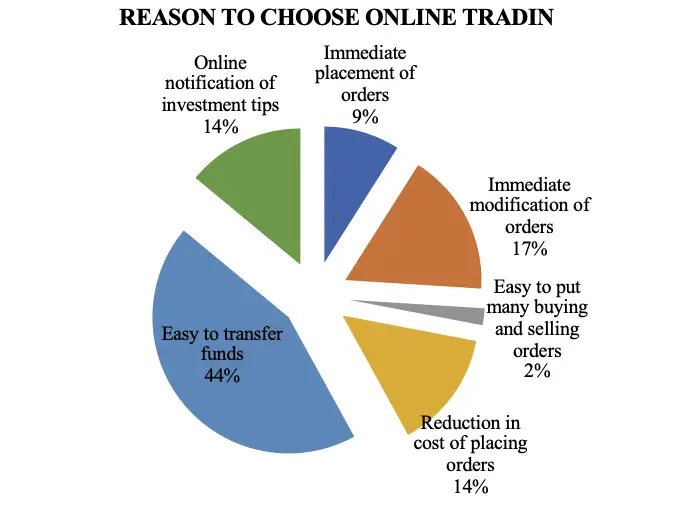
TABLE NO 4.20
PREFERED COMPANY SIZE
| S. No | Preferred company size | No. of Respondents | Percentage % |
| 1 | Large-cap | 55 | 55 |
| 2 | Mid cap | 31 | 31 |
| 3 | Small cap | 14 | 14 |
| Total | 100 | 100 |
Source: Primary Data
INTERPRETATION
From the above table, we found that 55% of the respondents prefer Large-cap company 31% of the respondents prefer Mid-cap companies 14% of the respondents prefer Small cap companies.
CHART NO 4.20
PREFERRED COMPANY SIZE
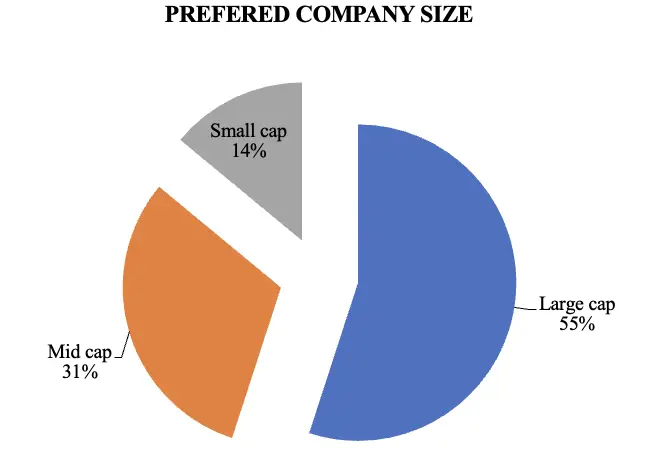
TABLE NO 4.21
TYPE OF MUTUAL FUND INVERSED
| S. No | Type of Mutual fund inversed | No. of Respondents | Percentage % |
| 1 | Debt fund | 22 | 22 |
| 2 | Equity fund | 64 | 64 |
| 3 | Both | 14 | 14 |
| Total | 100 | 100 |
Source: Primary Data
INTERPRETATION
From the above table, we found that 22% of the respondents invest in Debt funds, 64% of the respondents invest in Equity funds and 14% of the respondents invest in Both.
CHART NO 4.21
TYPE OF MUTUAL FUND INVERSED
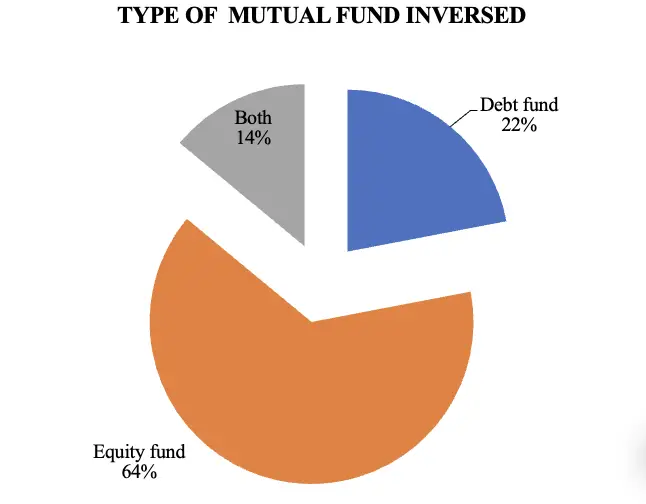
TABLE NO 4.22
ONLINE TRADING SAVE TRANSACTION TIME
| S. No | Online Trading save transaction time | No. of Respondents | Percentage % |
| 1 | Strongly Agree | 31 | 31 |
| 2 | Agree | 49 | 49 |
| 3 | Neutral | 16 | 16 |
| 4 | Disagree | 1 | 1 |
| 5 | Strongly Disagree | 3 | 3 |
| Total | 100 | 100 |
Source: Primary Data
INTERPRETATION
From the above table, we found that 31% of the respondents Strongly Agree Online Trading save transaction time, 49% of the respondents Agree Online Trading save transaction time, 16% of the respondents Neutral Online Trading save transaction time, 1% of the respondents Disagree Online Trading save transaction time and 3% of the respondents Strongly Disagree Online Trading save transaction time.
CHART NO 4.22
ONLINE TRADING SAVE TRANSACTION TIME
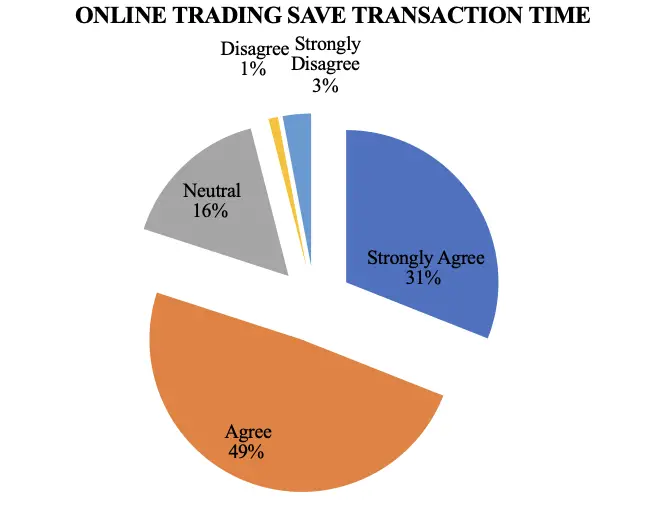
TABLE NO 4.23
ONLINE TRADING SYSTEM IS EASY AND FAST
| S. No | Online Trading System is easy and fast | No. of Respondents | Percentage % |
| 1 | Yes | 72 | 72 |
| 2 | No | 22 | 22 |
| 3 | Don’t Know | 6 | 6 |
| Total | 100 | 100 |
Source: Primary Data
INTERPRETATION
From the above table, we found that 72% of the respondents say online Trading System is easy and fast and 22% of the respondents says online Trading System is not easy and fast 6% of the respondents say Don’t Know About Online Trading System.
CHART NO 4.23
ONLINE TRADING SYSTEM IS EASY AND FAST
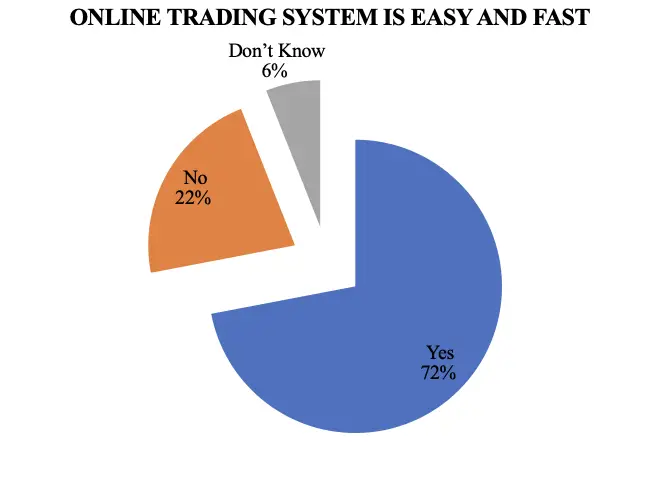
TABLE NO 4.24
TIME-SAVING IS AN IMPORTANT FACTOR IN ONLINE TRADING SYSTEM
| S. No | Time-saving is an important factor in Online Trading System | No. of Respondents | Percentage % |
| 1 | Yes | 61 | 61 |
| 2 | No | 19 | 19 |
| 3 | Don’t Know | 20 | 20 |
| Total | 100 | 100 |
Source: Primary Data
INTERPRETATION
From the above table, we found that 61% of the respondents say Time-saving is an important factor in Online Trading System, 19% of the respondents say Time-saving is not an important factor in Online Trading System and 20% of the respondents says Don’t Know about Time-saving in Online Trading System Don’t Know.
CHART NO 4.24
TIME-SAVING IS AN IMPORTANT FACTOR IN ONLINE TRADING SYSTEM
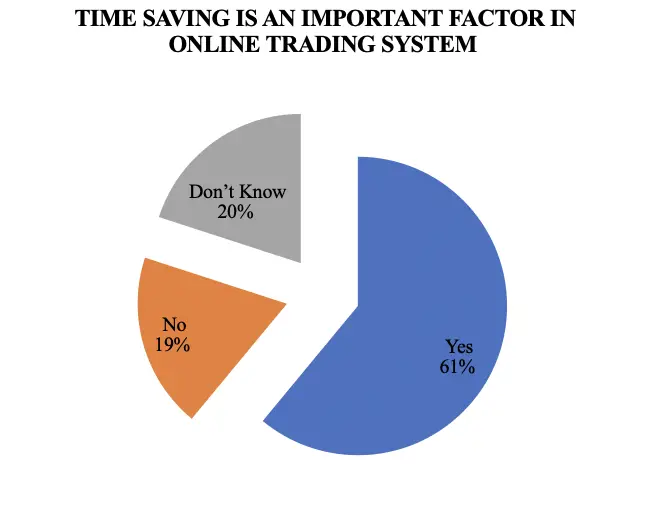
TABLE NO 4.25
ONLINE TRADING HELPS INDIAN STOCK MARKET GROWTH
| S. No | Online Trading helps Indian Stock Market growth | No. of Respondents | Percentage % |
| 1 | Yes | 71 | 55 |
| 2 | No | 17 | 31 |
| 3 | Don’t Know | 12 | 14 |
| Total | 100 | 100 |
Source: Primary Data
INTERPRETATION
From the above table, we found that 71% of the respondents say Online Trading helps Indian Stock Market growth, 17% of the respondents say Online Trading didn’t help Indian Stock Market growth and 12% of the respondents says Don’t Know.
CHART NO 4.25
ONLINE TRADING HELPS INDIAN STOCK MARKET GROWTH
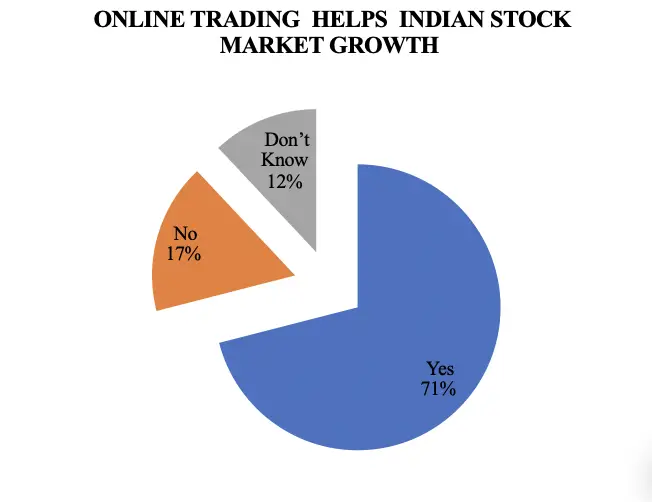
TABLE NO 4.26
AWARE OF THE RISK & RETURN PARAMETER
| S. No | Aware of the risk & return parameter | No. of Respondents | Percentage % |
| 1 | Very high | 37 | 37 |
| 2 | High | 13 | 13 |
| 3 | Low | 19 | 19 |
| 4 | Very Low | 31 | 31 |
| Total | 100 | 100 |
Source: Primary Data
INTERPRETATION
From the above table we found that 37% of the respondents were Awareness of the risk & return parameter is Very high, 13% of the respondents were Awareness of the risk & return parameter is High, 19% of the respondents were Awareness of the risk & return parameter is Low and 31% of the respondents were Awareness of the risk & return parameter is Very Low.
CHART NO 4.26
AWARE OF THE RISK & RETURN PARAMETER
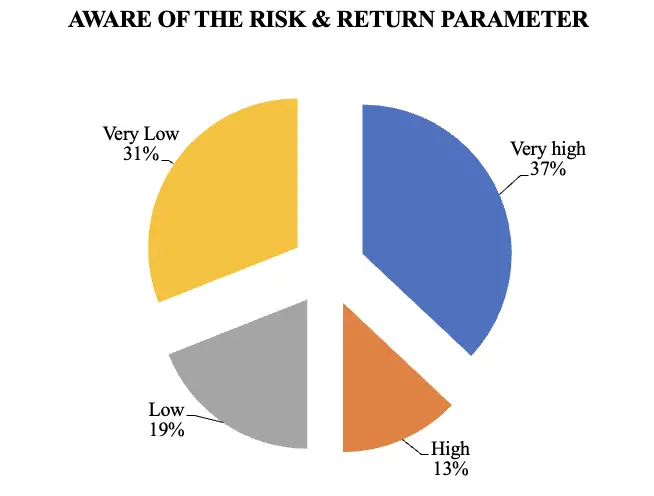
TABLE NO 4.27
AWARE OF THE SCHEME BASED PARAMETER IN MUTUAL FUND
| S. No | Aware of the scheme-based parameter in mutual fund | No. of Respondents | Percentage % |
| 1 | Very high | 21 | 21 |
| 2 | High | 29 | 29 |
| 3 | Low | 39 | 39 |
| 4 | Very Low | 11 | 11 |
| Total | 100 | 100 |
Source: Primary Data
INTERPRETATION
From the above table, we found that 21% of the respondent’s awareness about various schemes is Very high, 29% of the respondent’s awareness about various schemes is High, 39% of the respondent’s awareness about various schemes is Low and 11% of the respondent’s awareness about various schemes is Very Low.
CHART NO 4.27
AWARE OF THE SCHEME BASED PARAMETER IN MUTUAL FUND
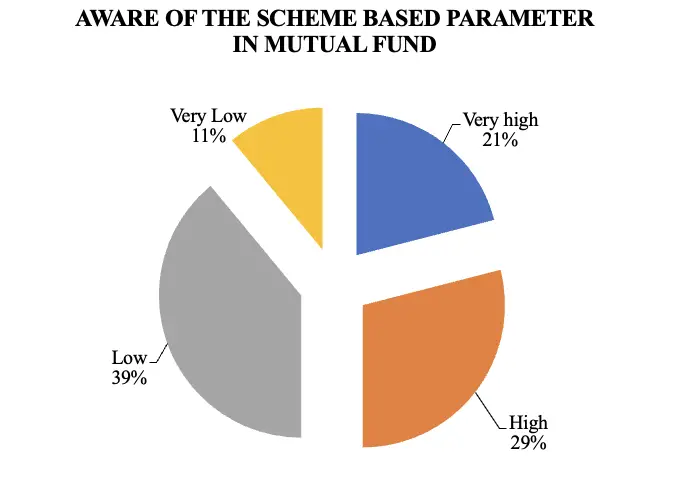
TABLE NO 4.28
IMPORTANCE GIVEN FOR SCHEME BASED INVESTMENT
| S. No | The importance given for scheme-based investment | No. of Respondents | Percentage % |
| 1 | Very high | 65 | 65 |
| 2 | High | 25 | 25 |
| 3 | Low | 10 | 10 |
| 4 | Very Low | 0 | 0 |
| Total | 100 | 100 |
Source: Primary Data
INTERPRETATION
From the above table, we found that 65% of the respondents say importance given for scheme-based investment is Very high, 25% of the respondents say importance given for scheme-based investment is High and 10% of the respondents say importance given for scheme-based investment is Low.
CHART NO 4.28
IMPORTANCE GIVEN FOR SCHEME BASED INVESTMENT
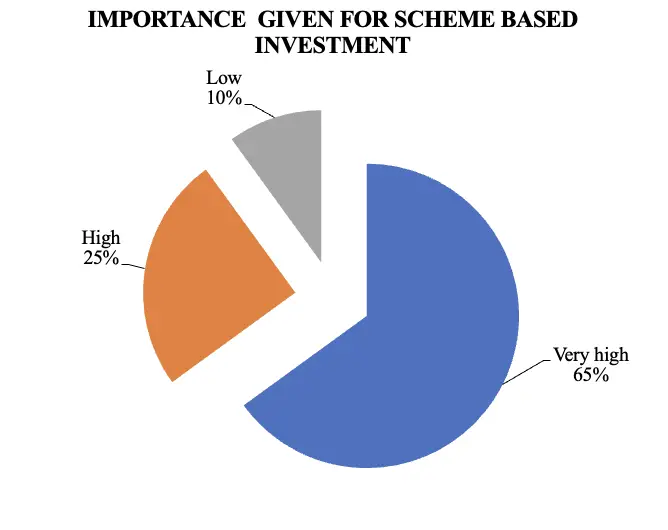
TABLE NO 4.29
RISK & RETURN IMPACT ON MUTUAL FUND INVESTMENT
| S. No | Risk & return impact on mutual fund investment | No. of Respondents | Percentage % |
| 1 | Very high | 37 | 37 |
| 2 | High | 13 | 13 |
| 3 | Low | 19 | 19 |
| 4 | Very Low | 31 | 31 |
| Total | 100 | 100 |
Source: Primary Data
INTERPRETATION
From the above table we found that 37% of the respondents feel risk & return impact on mutual fund investment is Very high, 13% of the respondents feel risk & return impact on mutual fund investment is High, 19% of the respondents feel risk & return impact on mutual fund investment is Low and 31% of the respondents feel risk & return impact on mutual fund investment is Very Low.
CHART NO 4.29
RISK & RETURN IMPACT ON MUTUAL FUND INVESTMENT
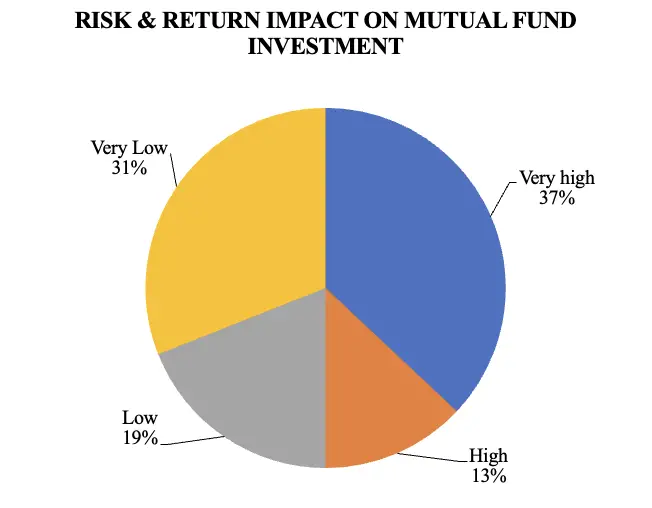
TABLE NO 4.30
PROFESSIONALS’ ADVICE
| S. No | Professionals’ advice | No. of Respondents | Percentage % |
| 1 | Strongly Agree | 27 | 27 |
| 2 | Agree | 66 | 66 |
| 3 | Neutral | 5 | 5 |
| 4 | Disagree | 2 | 2 |
| 5 | Strongly Disagree | 0 | 0 |
| Total | 100 | 100 |
Source: Primary Data
INTERPRETATION
From the above table, we found that 27% of the respondents say Strongly Agree that professionals’ advice is useful in investment, 66% of the respondents say Agree that professionals’ advice is useful in investment, 5% of the respondents say Neutral about professionals’ advice is useful in investment and 2% of the respondents say Disagree that professionals’ advice is useful in investment.
CHART NO 4.30
PROFESSIONALS’ ADVICE
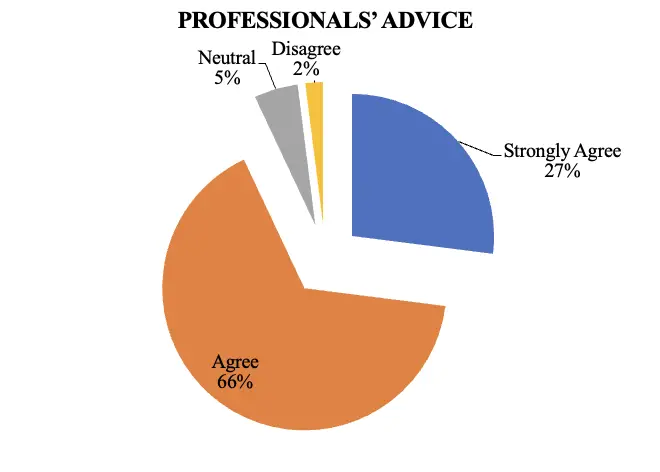
TABLE NO 4.31
CHANGES IN GOVERNMENT POLICIES
| S. No | Changes in Government Policies | No. of Respondents | Percentage % |
| 1 | Strongly Agree | 3 | 3 |
| 2 | Agree | 71 | 71 |
| 3 | Neutral | 11 | 11 |
| 4 | Disagree | 5 | 5 |
| 5 | Strongly Disagree | 10 | 10 |
| Total | 100 | 100 |
Source: Primary Data
INTERPRETATION
From the above table, we found that 3% of the respondents were Strongly Agree that government policy should change, 71% of the respondents were Agree that government policy should change, 11% of the respondents were Neutral that government policy should change, 5% of the respondents were Disagree that government policy should change and 10% of the respondents were Strongly Disagree that government policy should change.
CHART NO 4.31
CHANGES IN GOVERNMENT POLICIES
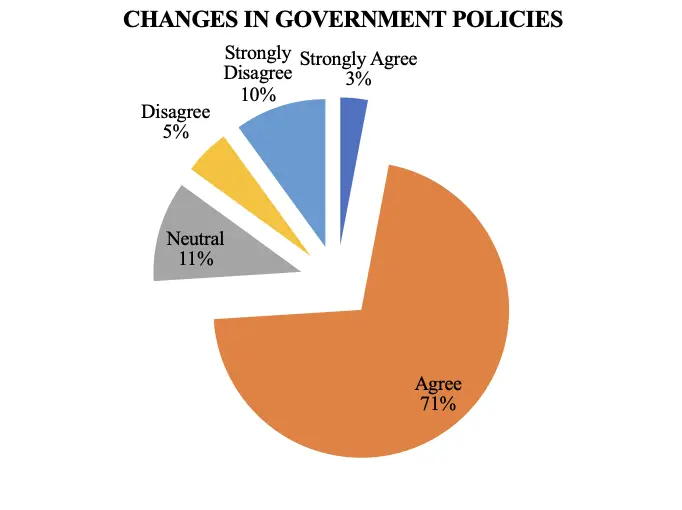
TABLE NO 4.32
CHANGES IN ECONOMIC PARAMETERS OF OUR COUNTRY
| S.No | Changes in Economic Parameters of our country | No. of Respondents | Percentage % |
| 1 | Strongly Agree | 72 | 72 |
| 2 | Agree | 11 | 11 |
| 3 | Neutral | 8 | 8 |
| 4 | Disagree | 4 | 4 |
| 5 | Strongly Disagree | 5 | 5 |
| Total | 100 | 100 |
Source: Primary Data
INTERPRETATION
From the above table, we found that 72% of the respondents were Strongly Agree that changes in the Economic Parameters of our country. 11% of the respondents were Agree that changes in the Economic Parameters of our country. 8% of the respondents were Neutral that changes in the Economic Parameters of our country. 4% of the respondents were Disagree that changes in the Economic Parameters of our country and 5% of the respondents were Strongly Disagree that changes in the Economic Parameters of our country.
CHART NO 4.32
CHANGES IN ECONOMIC PARAMETERS OF OUR COUNTRY
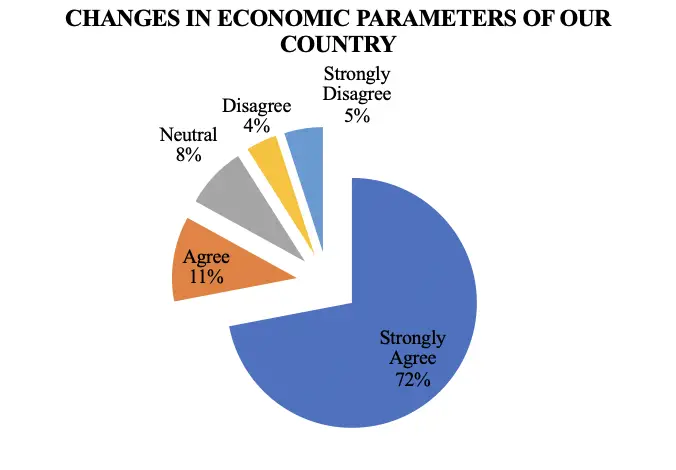
TABLE NO 4.33
CHANGES IN THE WORLD STOCK MARKET
| S. No | Changes in the world stock market | No. of Respondents | Percentage % |
| 1 | Strongly Agree | 43 | 43 |
| 2 | Agree | 21 | 21 |
| 3 | Neutral | 8 | 8 |
| 4 | Disagree | 6 | 6 |
| 5 | Strongly Disagree | 22 | 22 |
| Total | 100 | 100 |
Source: Primary Data
INTERPRETATION
From the above table, we found that 43% of the respondents were Strongly Agree that changes in the world stock market, 21% of the respondents were Agree that changes in the world stock market, 8% of the respondents were Neutral about changes in the world stock market, 6% of the respondents were Disagree about changes in world stock market and 22% of the respondents were Strongly Disagree about changes in world stock market.
CHART NO 4.33
CHANGES IN THE WORLD STOCK MARKET
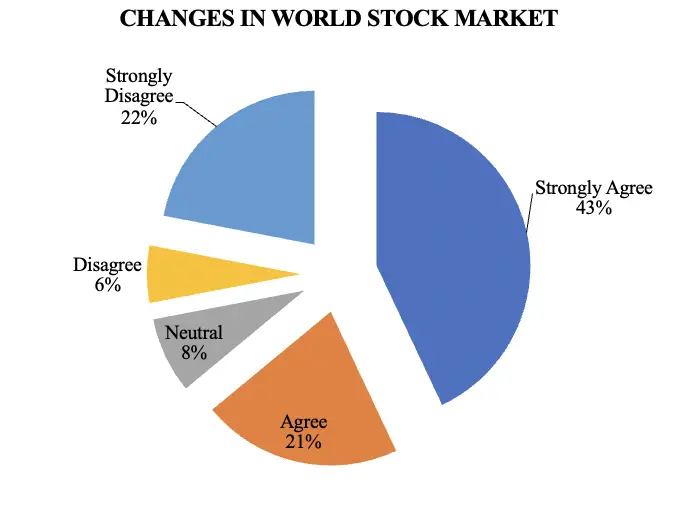
TABLE NO 4.34
CHANGES IN GOLD RATE
| S. No | Changes in gold rate | No. of Respondents | Percentage % |
| 1 | Strongly Agree | 27 | 27 |
| 2 | Agree | 39 | 39 |
| 3 | Neutral | 11 | 11 |
| 4 | Disagree | 7 | 7 |
| 5 | Strongly Disagree | 16 | 16 |
| Total | 100 | 100 |
Source: Primary Data
INTERPRETATION
From the above table, we found that 27% of the respondents were Strongly Agree that gold rate changes,39% of the respondents were Agree that gold rate changes,11% of the respondents were Neutral that gold rate changes,7% of the respondents were Disagree that gold rate changes and16% of the respondents were Strongly Disagree that gold rate changes.
CHART NO 4.34
CHANGES IN GOLD RATE
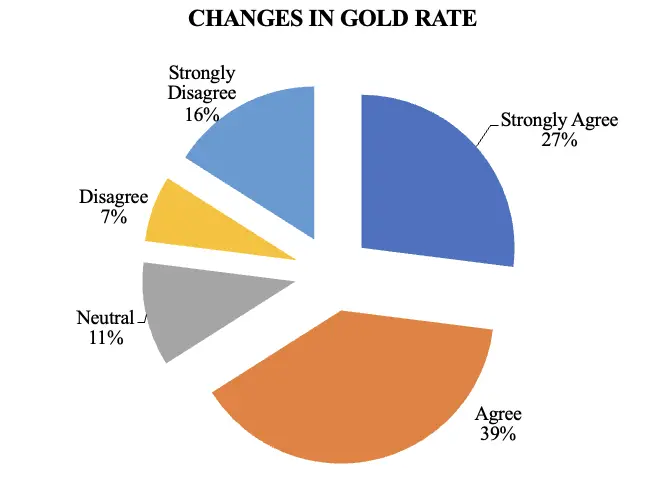
TABLE NO 4.35
FINANCIAL RESULTS OF COMPANIES
| S.No | Financial results of companies | No. of Respondents | Percentage % |
| 1 | Strongly Agree | 66 | 66 |
| 2 | Agree | 29 | 29 |
| 3 | Neutral | 5 | 5 |
| 4 | Disagree | 0 | 0 |
| 5 | Strongly Disagree | 0 | 0 |
| Total | 100 | 100 |
Source: Primary Data
INTERPRETATION
From the above table, we found that 66% of the respondents were Strongly Agree the financial results of companies, 29% of the respondents were Agree with the financial results of companies and 5% of the respondents were Neutral on the financial results of companies.
CHART NO 4.35
FINANCIAL RESULTS OF COMPANIES
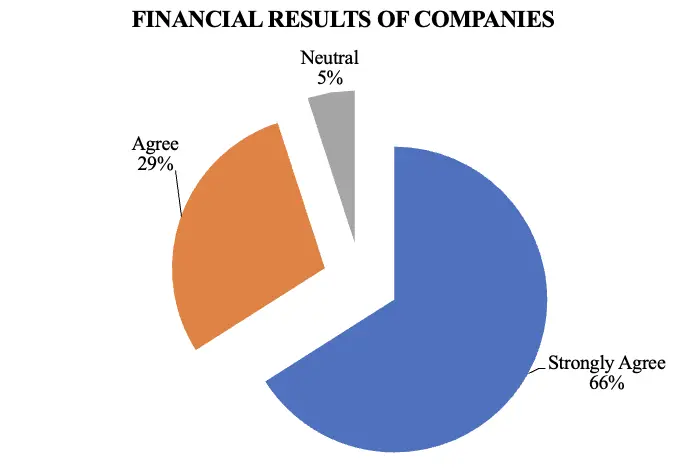
TABLE NO 4.36
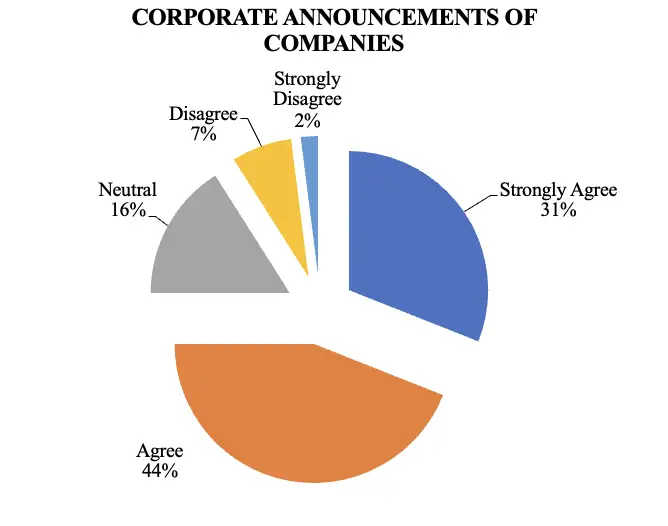
CORPORATE ANNOUNCEMENTS OF COMPANIES
| S.No | Corporate announcements of companies | No. of Respondents | Percentage % |
| 1 | Strongly Agree | 31 | 31 |
| 2 | Agree | 44 | 44 |
| 3 | Neutral | 16 | 16 |
| 4 | Disagree | 7 | 7 |
| 5 | Strongly Disagree | 2 | 2 |
| Total | 100 | 100 |
Source: Primary Data
INTERPRETATION
From the above table, we found that 31% of the respondents were Strongly Agree that corporate announcements of companies, 44% of the respondents were Agree that corporate announcements of companies, 16% of the respondents were Neutral that corporate announcements of companies, 7% of the respondents were Disagree that corporate announcements of companies and 2% of the respondents were Strongly Disagree that corporate announcements of companies.
CHART NO 4.36
CORPORATE ANNOUNCEMENTS OF COMPANIES
CHI-SQUARE ANALYSIS
TO FIND THE ASSOCIATION BETWEEN TYPE OF INVESTOR AND NUMBER OF COMPANIES INVESTED
Null Hypothesis
H0-There is a significant difference between the type of investor and the number of companies invested.
H1-There is no significant difference between the type of investor and the number of companies invested.
Table No. 4.37
TYPE OF INVESTOR AND NUMBER OF COMPANIES INVESTED
| Chi-Square Tests | |||
| Value | df | Asymp. Sig. (2-sided) | |
| Pearson Chi-Square | 58.287a | 16 | .000 |
| Likelihood Ratio | 43.714 | 16 | .000 |
| Linear-by-Linear Association | 21.181 | 1 | .000 |
| N of Valid Cases | 100 | ||
INTERPRETATION
In the above table Pearson Chi-Square result revealed that there is a statistically significant association between type of investor and number of companies invested.χ(4) =58.287a, p = .000).
TO FIND THE ASSOCIATION BETWEEN SIZE OF INVESTMENT IN SHARES AND PREFERRED MODE OF TRADING
Null Hypothesis
H0 There is a significant difference between the Size of investment in shares and the preferred Mode of trading
H1 There is no significant difference between the Size of investment in shares and the preferred Mode of trading
Table No. 4.38
SIZE OF INVESTMENT IN SHARES AND PREFERRED MODE OF TRADING
| Chi-Square Tests | |||
| Value | df | Asymp. Sig. (2-sided) | |
| Pearson Chi-Square | 43.567a | 16 | .000 |
| Likelihood Ratio | 30.536 | 16 | .015 |
| Linear-by-Linear Association | 9.840 | 1 | .002 |
| N of Valid Cases | 100 |
INTERPRETATION
In the above table, the Pearson Chi-Square result revealed that there is a statistically significant association between the Size of investment in shares and the preferred Mode of trading (χ(4) =43.567a, p = .000).
Correlation Coefficient
To Find Correlation Coefficient Between Monthly Income And Category Of Investment
Let,
X be the respondent’s monthly income
Y be the category of investment
TABLE No: 4.39
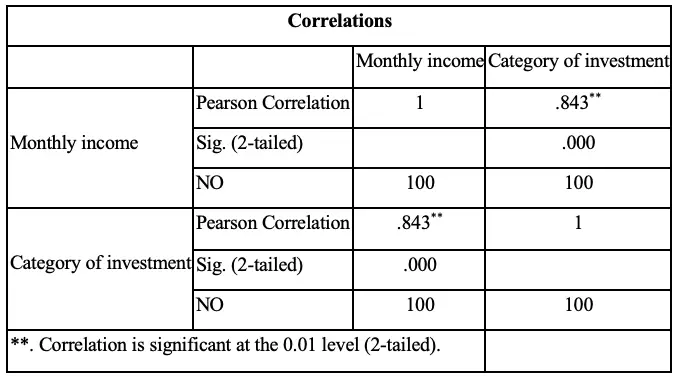
Interpretation
The above table gives the relationship between the variables, Monthly income and Category of investment. The result gives a positive correlation value of 0.843.
To Find Correlation Coefficient Between Mode Of Trading You Prefer And Preferred Company Size To Invest
Let,
X be the Mode of trading you prefer
Y be the Preferred company size to invest
TABLE No: 4.40
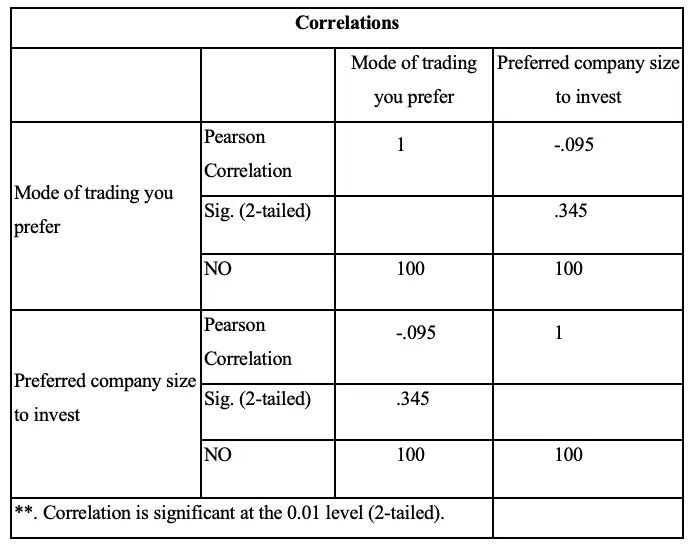
Interpretation
The above table gives the relationship between the variables, mode of trading you prefer and preferred company size to invest. The result gives a positive correlation value of 0.843.
5. Findings And Suggestions
5.1 Findings
Percentage Analysis
The majority of 44% of the respondents were in the age group above 60 years.
- Majority of 89% of the respondents were Male.
- Majority of 66% of the respondents were Married.
- Majority of 44% of the respondent’s education level is Under Graduate.
- Majority of 41% of the respondents were Government Employee.
- Majority of 22% of the respondents Family size Less than 4, 55% of the respondents Family size 4 to 6 and 23% of the respondents Family size Above 6.
- Majority of 42% of the respondent’s number of earning member in their family is 2.
- Majority of 41% of the respondent’s monthly income range is Rs. 60,000 & above.
- Majority of 49% of the respondents aware about mutual fund through Business newspapers.
- Majority of 83% of the respondents were Hereditary investor.
- Majority of 70% of the respondents prefer Long term investor.
- Majority of 69% of the respondents invested in Less than 10.
- Majority of 66% of the respondents were invested Rs. 1 lakh – Rs. 2 lakhs.
- Majority of 53% of the respondents saves their savings in share 30% and above.
- Most of 32% of the respondents prefer to invest in Mutual fund.
- Majority of 77% of the respondents were investing Upto2years.
- Majority of 66% of the respondents invest Weekly.
- Majority of 69% of the respondents prefer to trade in Offline.
- Most of 44% of the respondents choose online trading because it is Easy to transfer funds.
- Majority of 55% of the respondents prefer Large cap company.
- Majority of 64% of the respondents invest in Equity fund.
- Majority of 72% of the respondents says online Trading System is easy and fast.
- Majority of 61% of the respondents says Time saving is an important factor in Online Trading System.
- Majority of 71% of the respondents says Online Trading helps Indian Stock Market growth.
- Most of 37% of the respondents were Awareness of the risk & return parameter is Very high.
- Most of 39% of the respondent’s awareness about various schemes is Low.
- Majority of 65% of the respondents says importance given for scheme-based investment is Very high.
- Most of 37% of the respondents feel risk & return impact on mutual fund investment is Very high.
- Majority of 66% of the respondents says Agree that professionals’ advice is useful in investment.
- Majority of 71% of the respondents were Agree that government policy should change.
- Majority of 72% of the respondents were Strongly Agree that changes in Economic Parameters of our country.
- Most of 43% of the respondents were Strongly Agree that changes in world stock market.
- Most of 39% of the respondents were Agree that gold rate changes.
- Majority of 66% of the respondents were Strongly Agree that financial results of companies.
- Most of 44% of the respondents were Agree that corporate announcements of companies.
Chi-Square Analysis
- In the above table Pearson Chi-Square result revealed that there is a statistically significant association between type of investor and number of companies invested. χ (4) =58.287a, p = .000).
- In the above table Pearson Chi-Square result revealed that there is a statistically significant association between Size of investment in shares and preferred Mode of trading (χ (4) =43.567a, p = .000).
Correlation
- The above table gives the relationship between the variables, Monthly income and Category of investment. The result gives positive correlation value of 0.843.
- The above table gives the relationship between the variables, mode of trading you prefer and preferred company size to invest. The result gives positive correlation value of 0.843.
5.2 suggestions
- There is need to create awareness about commodity Future Market. Awareness program has to be conducted by Angel consultants, because since this was new to the market .so it can be done through by giving advertisements in local channels, Newspapers, by sending E-mail to present customers etc.
- From survey it is found that most of the potential customers are concerned about the Brokerage charges so Angel can look upon this. If it can charge moderate brokerage it will help to attract more and more customers.
- “Dabba trading” in commodity market in India.
- The FMC should increase the range of commodities in future commodities in commodity market in India.
- To motivate the commodity business in India the FMC should come up with some rebate in taxes.
- The FMC should increase the delivery centers of commodities in India.
- As commodity market is very potential for business, the angel co. should think about various ways to attract the customers.
6. Conclusion
The buying intent of a mutual fund product by a small investor can be due to multiple reasons depending upon the risk-return trade-off. Due to the reduction in the bank interest rates and a high degree of volatility in the Indian Stock market, investors are looking at an alternative for their investments, which will provide them higher, returns and also safety to their investments.
The financial services sector in India is one of the fastest-growing sectors. Awareness of the stock market among the people is increasing day by day. So, it is essential to know about the stock brokerage operating in our country and their services offered. This study identifies the source of awareness of shareholders’ investment proportion in the stock market, factors influencing investors decisions on buying and selling of funds.
Further, the study attempted to determine the satisfaction level on Stock Holding Corporation of India Ltd and the influence of demographic variables on the level of satisfaction. The investors have a good perception about the organization and are found satisfied with the services provided. However, the recommendations were given in this study which will implement for the further growth and development of the company.
Bibliography
Journal References
- Agarwal, G.D. (1992). “Mutual Funds and Investors Interest”, Chartered Secretary, Vol. 22(1):23-24. Atmaramani (1995). “SEBI regulations – A case for level playing field”, Analyst, December, pp 60-63. Atmaramani (1996). “Restoring investor confidence”, The Hindu Survey of Indian Industry, pp 435-437.
- Bamzai, S. (2000). “Meltdown blues impact industry”, Business India, April 21 – Sept.3, pp 120-132.
- Bhalla, V.K., (2004). Investment Management, 6 th edition, S. Chand & Co. Ltd, pp 2-3
- Bodla, B. S., Bishnoi, S. (2008). “Emerging trends of mutual funds in India: A study across category and type of schemes”, The Journal of Indian Management & Strategy, Vol. 13(1).
- Das, B., Mohanty, S., Shil Chandra N. (2008). “Mutual fund vs. life insurance: Behavioral analysis of retail investors”, International Journal of Business and Management, Vol. 3(10).
- Dutta, G. (2013). “Profitability Picture Improves for some Large and Small AMCs in FY12- 13”, Nov, http://www.morningstar.in/posts/20261/profitability-picture-improves-for-some- large-and-small-amcs-in-fy12-13.aspx
- Ellen, Schultz (1992). “CDs pegged to college costs look good to parents, but do they make the grade?”, The Wall Street Journal, March 29,1992, p.1.
- Festinger, L. (1957). A Theory of Cognitive Dissonance, Stanford: Stanford University Press.
- Goetzman, W.N (1997). “Cognitive dissonance and mutual fund investors”, The Journal of Financial Research, Vol. 20, pp 145-158.
- Gupta, L.C. (1994). “Mutual Funds and Asset Preference”, Society for Capital Market Research and Development, Delhi.
- Ippolito, R. (1992). “Consumer reaction to measures of poor quality: Evidence from mutual funds”, Journal of Law and Economics, Vol. 35, pp 45-70.
- IRIS (2013). “Mutual funds’ average AUM falls 4.5% in Q3’13th Oct”, http://www.myiris.com/newsCentre/storyShow.php?fileR=20131007173727715
- Kothari, C.R. (2006). Research Methodology, 2 Nd edition, New Delhi: New Age International Pvt. Ltd., pp 11, 130.
- Krishnan, M.A. (1999). “Moving into growth mode”, The Hindu Survey of Indian Industry, pp 112-114.
- Kulshreshta, C.M. (1994). Mastering Mutual Funds, New Delhi: Vision Books.
- Madhusudan V. Jambodekar (1996). “Marketing strategies of mutual funds – Current practices and future directions”, Working Paper, UTI – IIMB Centre for Capital Markets Education and Research, Bangalore.
- Rajan, R. (1997). “Chennai Investor is conservative”, Business Line, Feb. 23, p 25 20. Rajan,
- R. (1997). “Investment size-based segmentation of individual investors”, Management Researcher, Vol. 3(3 & 4): 21-28. 21. Rajan, R. (1998). “Stages in life cycle and investment pattern”, The Indian Journal of Commerce, Vol. 51(2 & 3): 27 – 36.
- Rathnamani, V. (2013). “Investor’s Preferences towards Mutual Fund Industry in Trichy”, IOSR Journal of Business and Management, Vol. 6 (6): 48-55.
- Ranganathan, K. (2006). “A Study of Fund Selection Behavior of Individual Investors towards Mutual Funds – with Reference to Mumbai City”.
- Rebello, Dominic (2013). “Mutual Funds AUM Decline in September Quarter”, Nov, http://www.afternoondc.in/business-investment/mutual-funds-aum-decline-in-september- quarter/article_95725.
- Sadhak, H. (1991). “The alternate saving media”, The Economic Times, April 30, p 9.
- Samir K. Barua et al. (1991). “Master shares: A bonanza for large investors”, Vikalpa, Vol. 16(1): 29-34.
- Sarish, Jain, A. (2012). “Analysis regarding mutual funds awareness and opinion”, VSRD- International Journal of Business & Management Research, Vol. 1(10): 1-7.
- Sarkar, A.K. (1991). “Mutual funds in India: Emerging trends”, Management Accountant, Vol. 26(3):171-194.
- SEBI – NCAER (2000). Survey of Indian Investors, SEBI, Mumbai.
- Shankar, V. (1996). “Retailing mutual funds: A consumer product model”, The Hindu, July 24, p 26.
- Sharma, C. Lall (1991). “Mutual funds – How to keep them on right track”, Yojana, Vol. 35 (23): 18-19.
- Sikidar, S. and Singh, A.P. (1996). ‘Financial services: Investment in equity and mutual funds
- A behavioral study”, in Bhatia B.S., and Batra G.S., (ed.), Management of Financial Services, New Delhi: Deep and Deep Publications, Chapter 10, pp 136-145.
- Singh, P. (2005). Investment Management, 6 th edition, Himalaya Publishing house, pp 1-5.
Credit: This project “Comparative Study Of Individual Investors: Physical Assets Vs Financial Assets” was completed by Adhavan.V Under the Guidance of Mrs Gowri lingeswari Assistant Professor Department of Management Science, Sri Krishna Arts and Science College, Coimbatore, INDIA 641008.
Leave a Reply