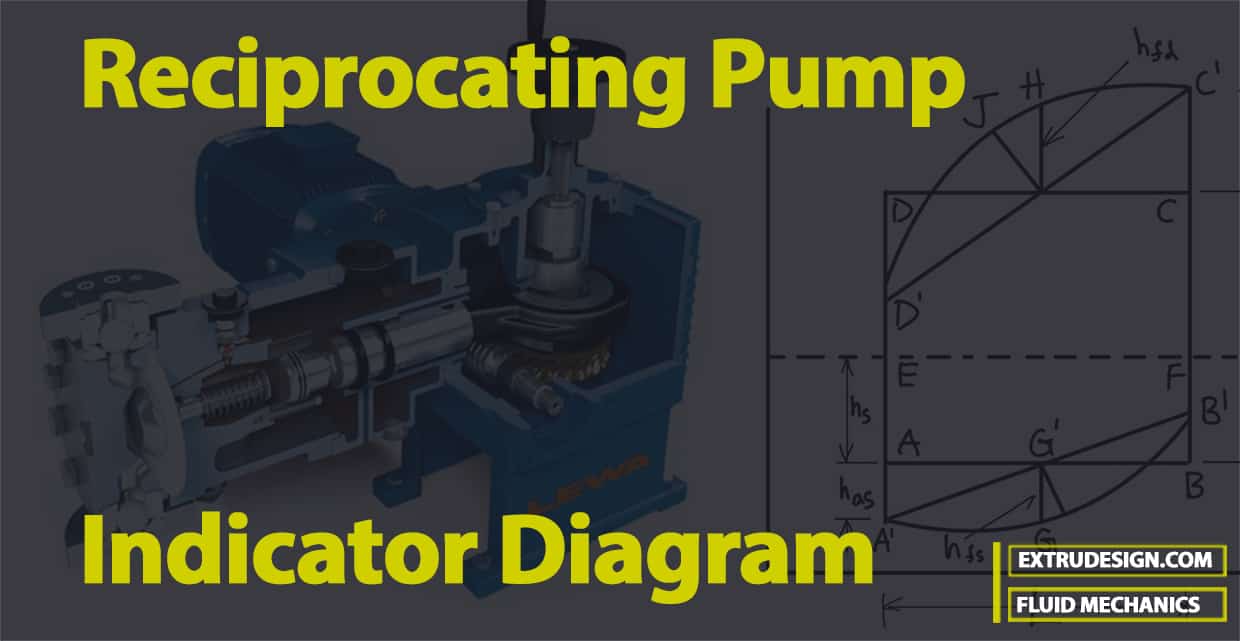
An Indicator diagram is a graph between the pressure versus the length of the stroke in reciprocating cylinders. The Reciprocating Pump Indicator Diagram will help us understand the relationship between the pressure head in the cylinder and the distance travelled by the piston from the inner dead centre for one complete revolution of the crank. Let us understand how we can draw the indicator diagram for the reciprocating Pumps.

Reciprocating Pump
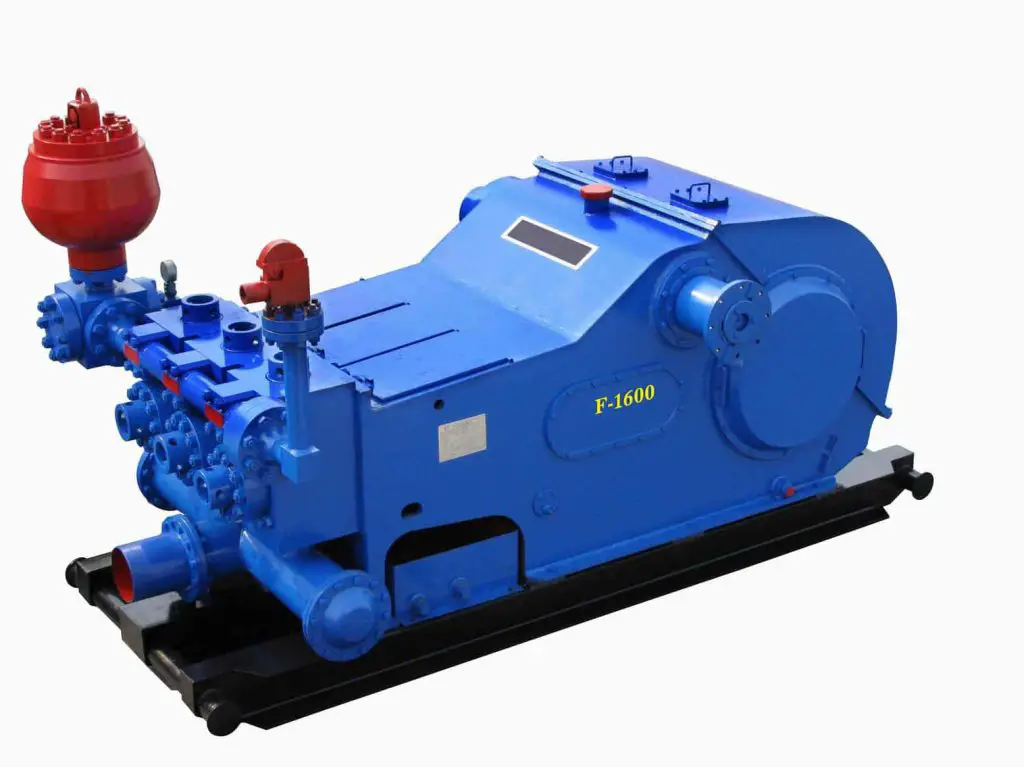
The hydraulic machines, which convert the hydraulic energy into mechanical energy, are called turbines while the hydraulic machines which convert mechanical energy into hydraulic energy are called pumps. Hydraulic energy is in the form of pressure energy. If the mechanical energy is converted into pressure energy by means of centrifugal force acting on the fluid, the hydraulic machine is called a centrifugal pump. If the mechanical energy is converted into hydraulic energy (or pressure energy) by sucking the liquid into a cylinder in which a piston is reciprocating (moving backwards and forwards), which exerts the thrust on the liquid and increases its hydraulic energy (pressure energy), the pump is known as the reciprocating pump.

The Reciprocating Pump consists of a single-acting reciprocating pump, consisting of a piston that moves forwards and backwards in a close-fitting cylinder. The movement of the piston is obtained by connecting the piston rod to the crank by means of a connecting rod. The crank is rotated by means of an electric motor.
Reciprocating Pump Ideal Indicator Diagram
The Reciprocating Pump Indicator Diagram will help us understand the relationship between the pressure head in the cylinder and the distance travelled by the piston from the inner dead centre for one complete revolution of the crank. As the maximum distance travelled by the piston is equal to the stroke length and hence the indicator diagram is a graph between the pressure head and stroke length of the piston for one complete revolution. The pressure head is taken as ordinate and stroke length as abscissa.
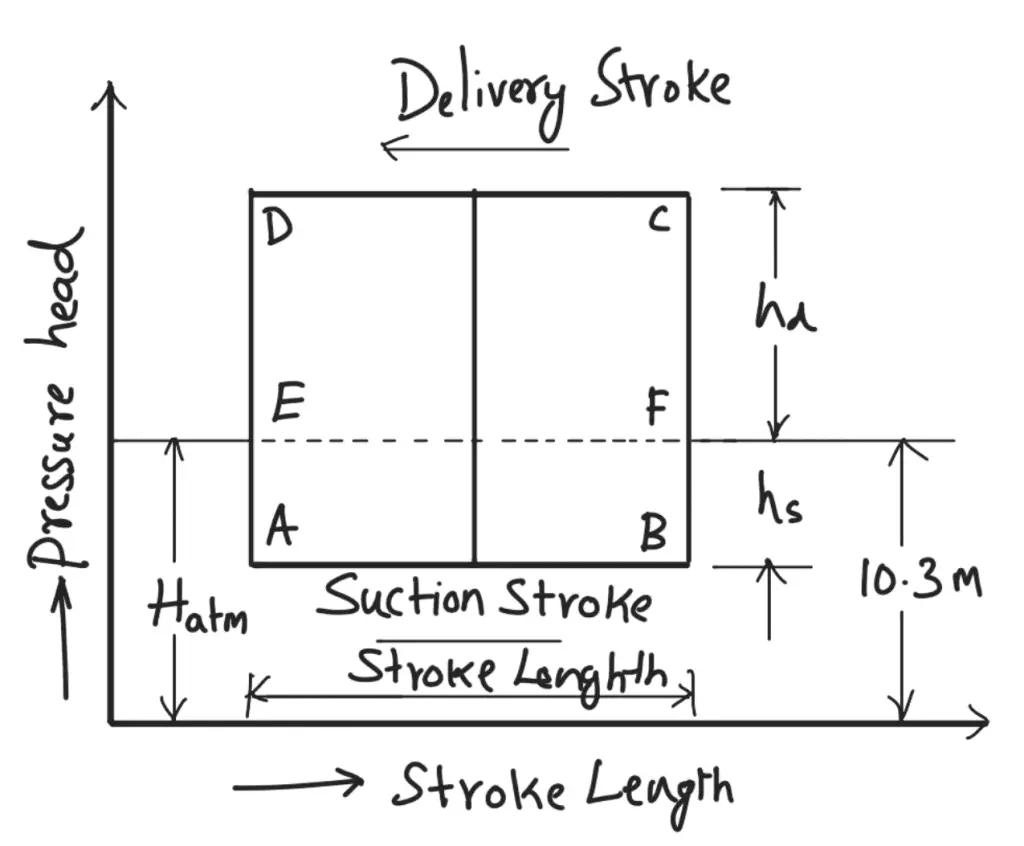
The graph between the pressure head in the cylinder and the stroke length of the piston for one complete revolution of the crank under ideal conditions is known as an ideal indicator diagram. The following graph shows the ideal indicator diagram, in which line EF represents the atmospheric pressure head equal to 10.3 m of water.

Let
Hatm = Atmospheric pressure head = 10.3m of water
L = Length of the stroke
hs = Suction Head
hd = Delivery Head
- During the suction stroke, the pressure head in the cylinder is constant and equal to the suction head (hs), which is below the atmospheric pressure head ( Hatm) by a height of hs.
- The pressure head during the suction stroke is represented by a horizontal line AB which is below the line EF by a height of hs.
- During the delivery stroke, the pressure head in the cylinder is constant and equal to the delivery head (hd), which is above the atmospheric head by a height of (hd).
- Thus, the pressure head during the delivery stroke is represented by a horizontal line CD which is above the line EF by a height of hd.
- Thus, for one complete revolution of the crank, the pressure head in the cylinder is represented by diagram A-B-C-D-A.
This diagram is known as the ideal indicator diagram.
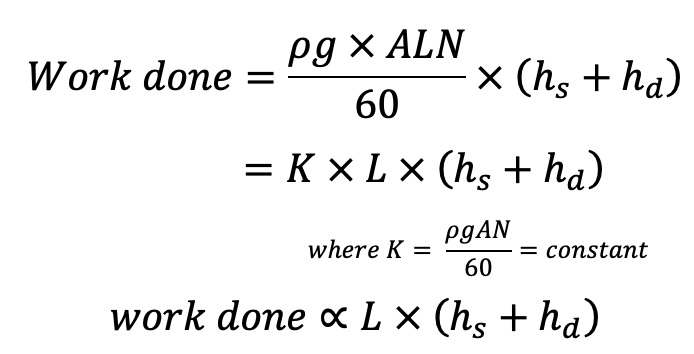
Now from the equation from the previous article, we know that the work done by the pump per second is

The area of the indicator diagram can be written as = AB × BC
= AB × (BF + FC)
= L × (hs + hd)
Substituting this value in the above equation, we get
Work done by pump ∝ Area of the indicator diagram.
This is all about the Reciprocating Pump Indicator Diagram. Let us know if you want to know the effect of acceleration and friction on the suction and delivery of the reciprocating pump represented on the Indicator diagram.

Leave a Reply