For any product development, Product Development planning is a necessary task for any kind of product. To perform this task, we have a different variety of tools. Such as Gantt Charts, PERT, CPM.

Product development Planning
Product Development planning Basic Constituents are
- What: Tasks
- When: Schedule
- Where: Equipment and facilities
- How: People, material, facility, and equipment costs
Product development Planning Steps
With these questions, we can plan the product development in an efficient manner.
- Identify the tasks and milestones of the project
- Supplement product tasks with team tasks
- Estimate project resources and time (updated…)
- Assign tasks to a timeline, including the parallel and sequential structure
- Monitor Progress and assign additional tasks
Product development Planning Tools
- Gantt Charts
- PERT
- CPM
Gantt chart
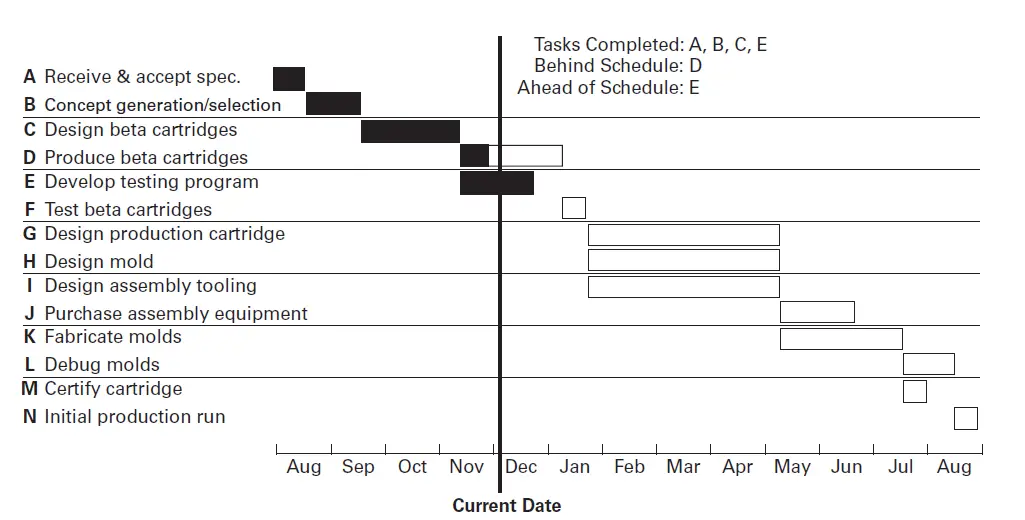
The traditional tool for representing the timing of tasks is the Gantt chart. The above schematic shows a Gantt chart for the Cheetah project. The chart contains a horizontal timeline created by drawing a horizontal bar representing the start and end of each task. The filled-in portion of each bar represents the fraction of the task that is complete. The vertical line in the Gantt chart shown here shows the current date, so we can observe directly that task D is behind schedule, while task E is ahead of schedule. A Gantt chart does not explicitly display the dependencies among tasks. Task dependencies constraint, but do not fully determine, the timing of the tasks. The dependencies dictate which tasks must be completed before others can begin (or finish, depending on the nature of the dependency) and which tasks can be completed in parallel. When two tasks overlap in time on a Gantt chart, they may be parallel, sequential, or iteratively coupled. Parallel tasks can be overlapped in time for convenience in project scheduling because they do not depend on one another. Sequential tasks might be overlapped in time, depending on the exact nature of the information dependency, as described below in the section on accelerating projects. Coupled tasks must be overlapped in time because they need to be addressed simultaneously or in an iterative fashion.
PERT Chart
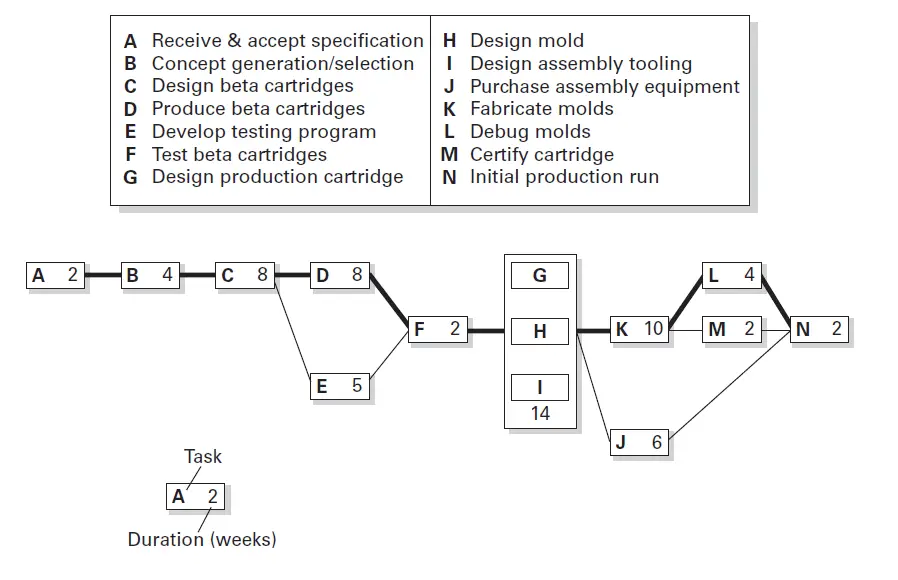
PERT (program evaluation and review technique) charts explicitly represent both dependencies and timing, in effect combining some of the information contained in the DSM and Gantt chart. While there are many forms of PERT charts, we prefer the “activities on nodes” form of the chart, which corresponds to the process diagrams that most people are familiar with. The PERT chart for the Cheetah project is shown above. The blocks in the PERT chart are labeled with both the task and its expected duration. Note that the PERT representation does not allow for loops or feedback and it cannot explicitly show iterative coupling either. As a result, the coupled tasks G, H, and I are grouped together into one task. The graphical convention of PERT charts is that all links between tasks must proceed from left to right, indicating the temporal sequence in which tasks can be completed. When the blocks are sized to represent the duration of tasks, as in a Gantt chart, then a PERT diagram can also be used to represent a project schedule.
CPM – Critical Path Method

The dependencies among the tasks in a PERT chart, some of which may be arranged sequentially and some of which may be arranged in parallel, lead to the concept of a critical path. The critical path is the longest chain of dependent events. This is the single sequence of tasks whose combined required times define the minimum possible completion time for the entire set of tasks. Consider for example the Cheetah project represented in PER Chart. Either the sequence C-D-F or the sequence C-E-F defines how much time is required to complete the four tasks C, D, E, and F. In this case, the path C-D-F requires 18 weeks and the path C-E-F requires 15 weeks, so the critical path for the whole project includes C-D-F. The critical path for the project is denoted by the thick lines in the above PERT chart. Identifying the critical path is important because a delay in any of these critical tasks would result in an increase in project duration. All other paths contain some slack, meaning that a delay in one of the noncritical tasks does not necessarily create a delay for the entire project. In the Gantt chart given above, it clearly shows that task D is behind schedule. Because task D is on the critical path, this delay, if not corrected, will result in a delay in the completion of the entire project. Several software packages are available for producing Gantt charts and PERT charts; these programs can also compute the critical path.
Conclusion
We have discussed the Product development Planning Steps, Product development Planning tools, such as Gantt charts, PERT Charts, CPM (Critical path method). Let us know if you have any further thoughts on this topic.
Leave a Reply